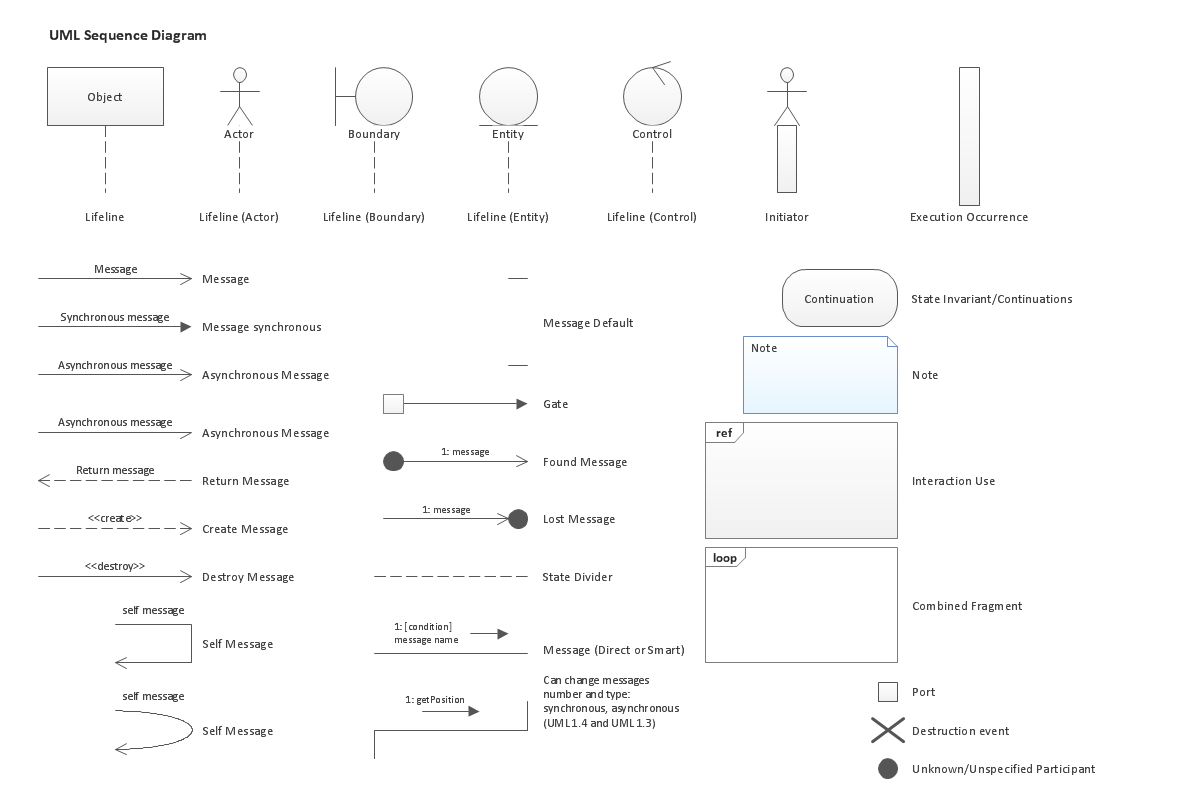
UML Sequence Diagram. Design Elements
UML Sequence Diagram shows object interactions arranged in time sequence, how processes operate with one another and in what order and illustrate the sequence of messages exchanged between the objects and classes involved in the scenario.
 Circular Arrows Diagrams
Circular Arrows Diagrams solution extends ConceptDraw DIAGRAM with extensive drawing tools, predesigned samples, Circular flow diagram template for quick start, and a library of ready circular arrow vector stencils for drawing Circular Arrow Diagrams, Segmented Cycle Diagrams, and Circular Flow Diagrams. The elements in this solution help managers, analysts, business advisers, marketing experts, scientists, lecturers, and other knowledge workers in their daily work.
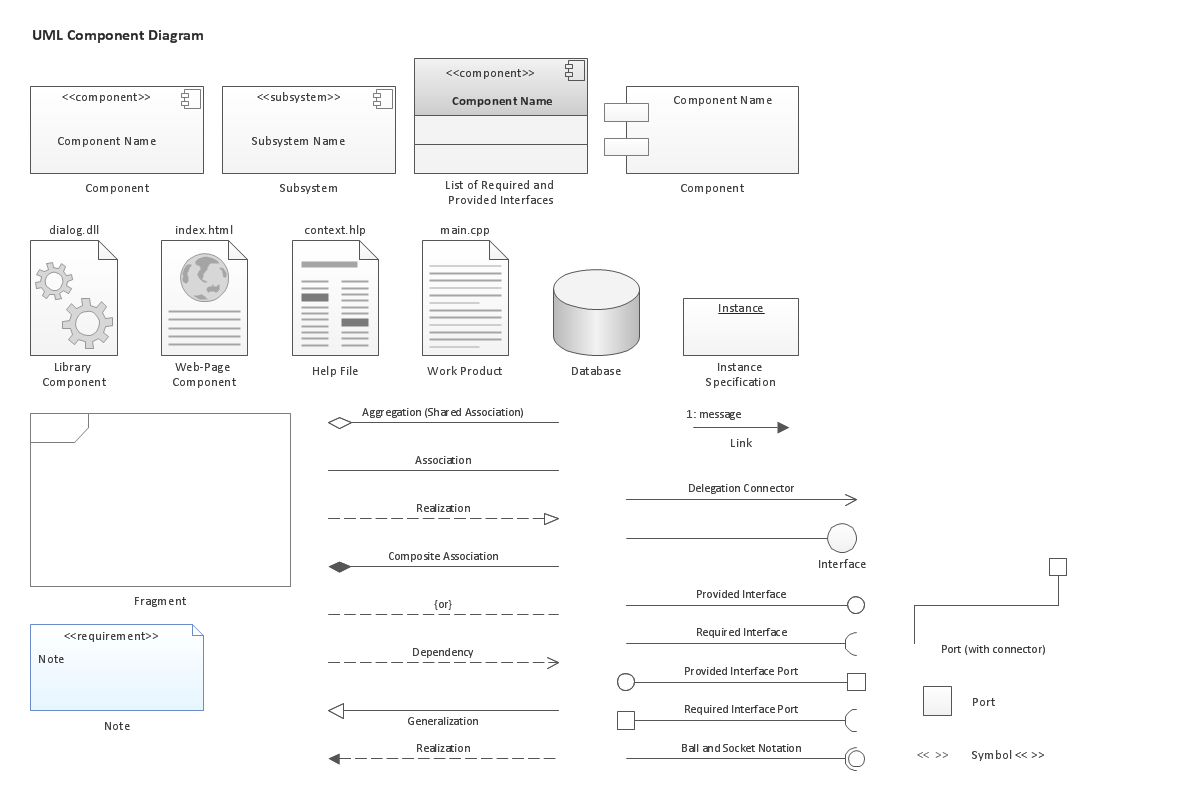
UML Component Diagram. Design Elements
UML Component Diagram illustrates show components are wired together to larger components and software systems that shows the structure of arbitrarily complex systems. Rapid UML Solution for ConceptDraw DIAGRAM contains 13 vector stencils libraries with 393 interactive shapes that you can use to design your UML diagrams. To design a Component Diagram use the UML Component Diagram library. UML Component Diagram library contains 36 shapes
UML Activity Diagram
UML Activity Diagram is a type of UML diagrams, which illustrates the business and operational step-by-step workflows of components within a system and shows the overall flow of control. UML Activity Diagram is constructed from a limited number of shapes, connected each other with arrows. The most important shape types are rounded rectangles, diamonds, bars, black circle, encircled black circle. The arrows represent the order in which activities happen and run from the start towards the end. ConceptDraw DIAGRAM software enhanced with Rapid UML solution is ideal for software designers and software developers who need to draw the UML Activity Diagrams and other types of UML diagrams. It is convenient to use the appropriate stencils of UML notation from the UML Activity library included to the Rapid UML solution of ConceptDraw Solution Park and containing a lot of specific vector UML objects. Use them to design your own UML Activity Diagrams, make them colorful and attractive with style tools of ConceptDraw DIAGRAM software.UML Notation
Unified Modeling Language (UML) is an open standard, the language of graphic description used for modeling objects in a field of software development and software engineering. It was created for definition, specification, visualization, designing and documenting software systems, as a unification of three object-oriented technologies Booch, OMT and OOSE, and uses the defined graphic notation for creating the visual models of object-oriented software systems. Description of UML consists of two parts, interactive and supplementing each other: UML semantics, which represents a certain metamodel, defines the abstract syntax and semantics of terms of object modeling with UML, and UML notation that is a graphic notation for visual representation of UML semantics. The powerful tools of the Rapid UML solution included to ConceptDraw Solution Park make the ConceptDraw DIAGRAM diagramming and vector drawing software the best for easy applying the UML notation when creating the visual models of object-oriented software systems and designing different kinds of UML diagrams.
 Basic Diagramming
This solution extends ConceptDraw DIAGRAM software with the specific tools you need to easily draw flowcharts, block diagrams, histograms, pie charts, divided bar diagrams, line graphs, circular arrows diagrams, Venn diagrams, bubble diagrams and concept maps
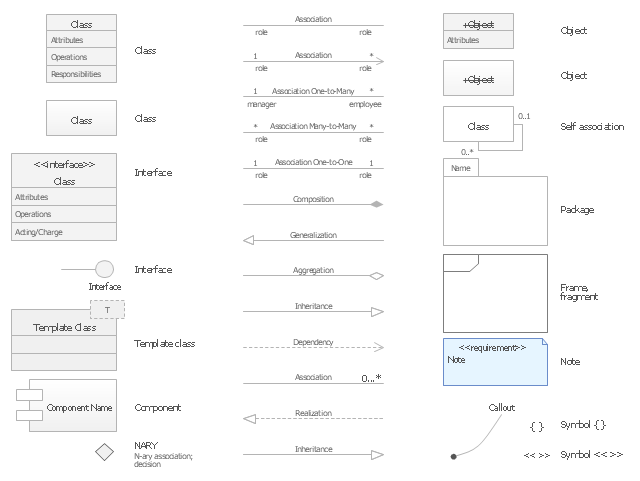
UML Class Diagram. Design Elements
UML Class Diagrams describes the structure of a system by showing the system's classes, their attributes, and the relationships among the classes.How to create a UML Diagram
ConceptDraw DIAGRAM extended with the Rapid UML solution is perfect for drawing professional UML diagrams.UML Diagram
The accepted open standard that is used in software engineering and system design, when modeling object-oriented systems and business processes is known as Unified Modeling Language (UML). UML was created for definition, visualization, design and documentation software systems. It isn't a programming language, but on the base of UML model can be generated code. UML uses generic set of graphic notations for creation an abstract model of the system called UML-model. The UML notation lets visually represent requirements, subsystems, structural and behavioral patterns, logical and physical elements, etc. UML defines 13 types of diagrams: Class (Package), Use Case, Sequence, Object, Collaboration, Component, Timing, Interaction Overview, State Machine, Composite Structure, Activity, and Deployment. All these types of UML Diagrams can be fast and easy created with powerful ConceptDraw DIAGRAM software extended with special Rapid UML solution from Software Development area of ConceptDraw Solution Park.Design Elements for UML Diagrams
The Rapid UML solution from Software Development area of ConceptDraw Solution Park includes 13 vector stencils libraries for drawing the UML 2.4 diagrams using ConceptDraw DIAGRAM diagramming and vector drawing software.The vector stencils library "UML class diagrams" contains 38 symbols for the ConceptDraw PRO diagramming and vector drawing software.
"... classes are represented with boxes which contain three parts:
(1) The top part contains the name of the class. It is printed in Bold, centered and the first letter capitalized.
(2) The middle part contains the attributes of the class. They are left aligned and the first letter is lower case.
(3) The bottom part gives the methods or operations the class can take or undertake. They are also left aligned and the first letter is lower case. ...
To indicate a classifier scope for a member, its name must be underlined. ...
An association can be named, and the ends of an association can be adorned with role names, ownership indicators, multiplicity, visibility, and other properties. ...
Aggregation ... is graphically represented as a hollow diamond shape on the containing class end of the tree with a single line that connects the contained class to the containing class.
... graphical representation of a composition relationship is a filled diamond shape on the containing class end of the tree of lines that connect contained class(es) to the containing class.
... graphical representation of a Generalization is a hollow triangle shape on the superclass end of the line (or tree of lines) that connects it to one or more subtypes.
... graphical representation of a Realization is a hollow triangle shape on the interface end of the dashed line (or tree of lines) that connects it to one or more implementers. A plain arrow head is used on the interface end of the dashed line that connects it to its users.
Multiplicity ... representation of an association is a line with an optional arrowhead indicating the role of the object(s) in the relationship, and an optional notation at each end indicating the multiplicity of instances of that entity (the number of objects that participate in the association).
Entity classes ... are drawn as circles with a short line attached to the bottom of the circle. Alternatively, they can be drawn as normal classes with the «entity» stereotype notation above the class name." [Class diagram. Wikipedia]
The example "Design elements - UML class diagrams" is included in the Rapid UML solution from the Software Development area of ConceptDraw Solution Park.
Data structure diagram with ConceptDraw DIAGRAM
Data structure diagram (DSD) is intended for description of conceptual models of data (concepts and connections between them) in the graphic format for more obviousness. Data structure diagram includes entities description, connections between them and obligatory conditions and requirements which connect them. Create Data structure diagram with ConceptDraw DIAGRAM.IDEF3 Standard
Use Case Diagrams technology. IDEF3 Standard is intended for description and further analysis of technological processes of an enterprise. Using IDEF3 standard it is possible to examine and model scenarios of technological processes.Sample for UML
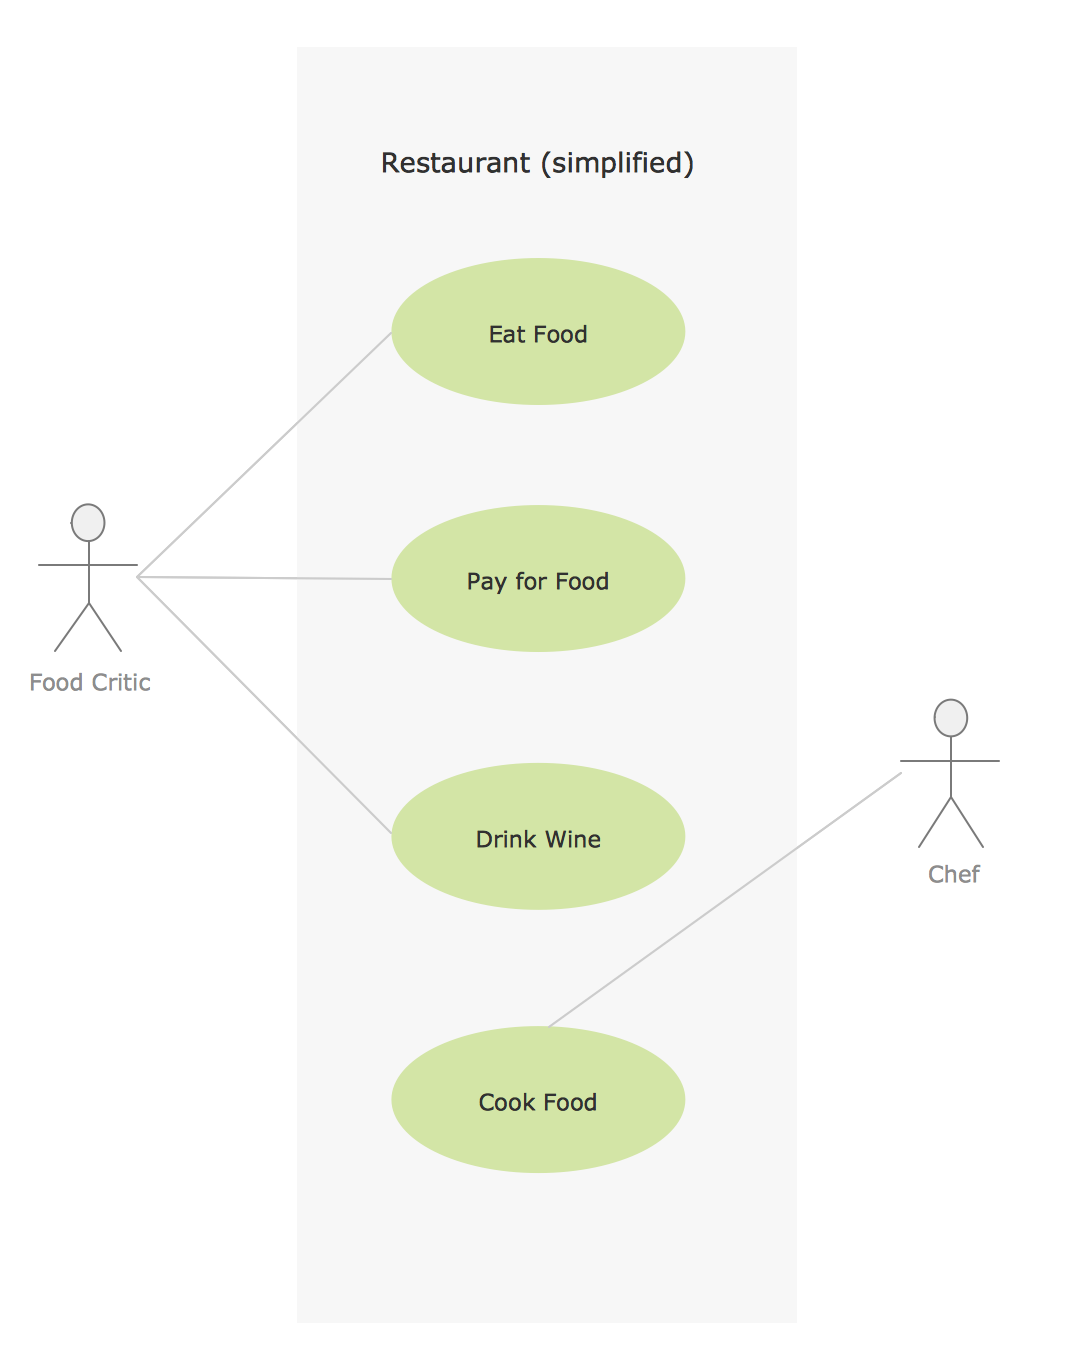
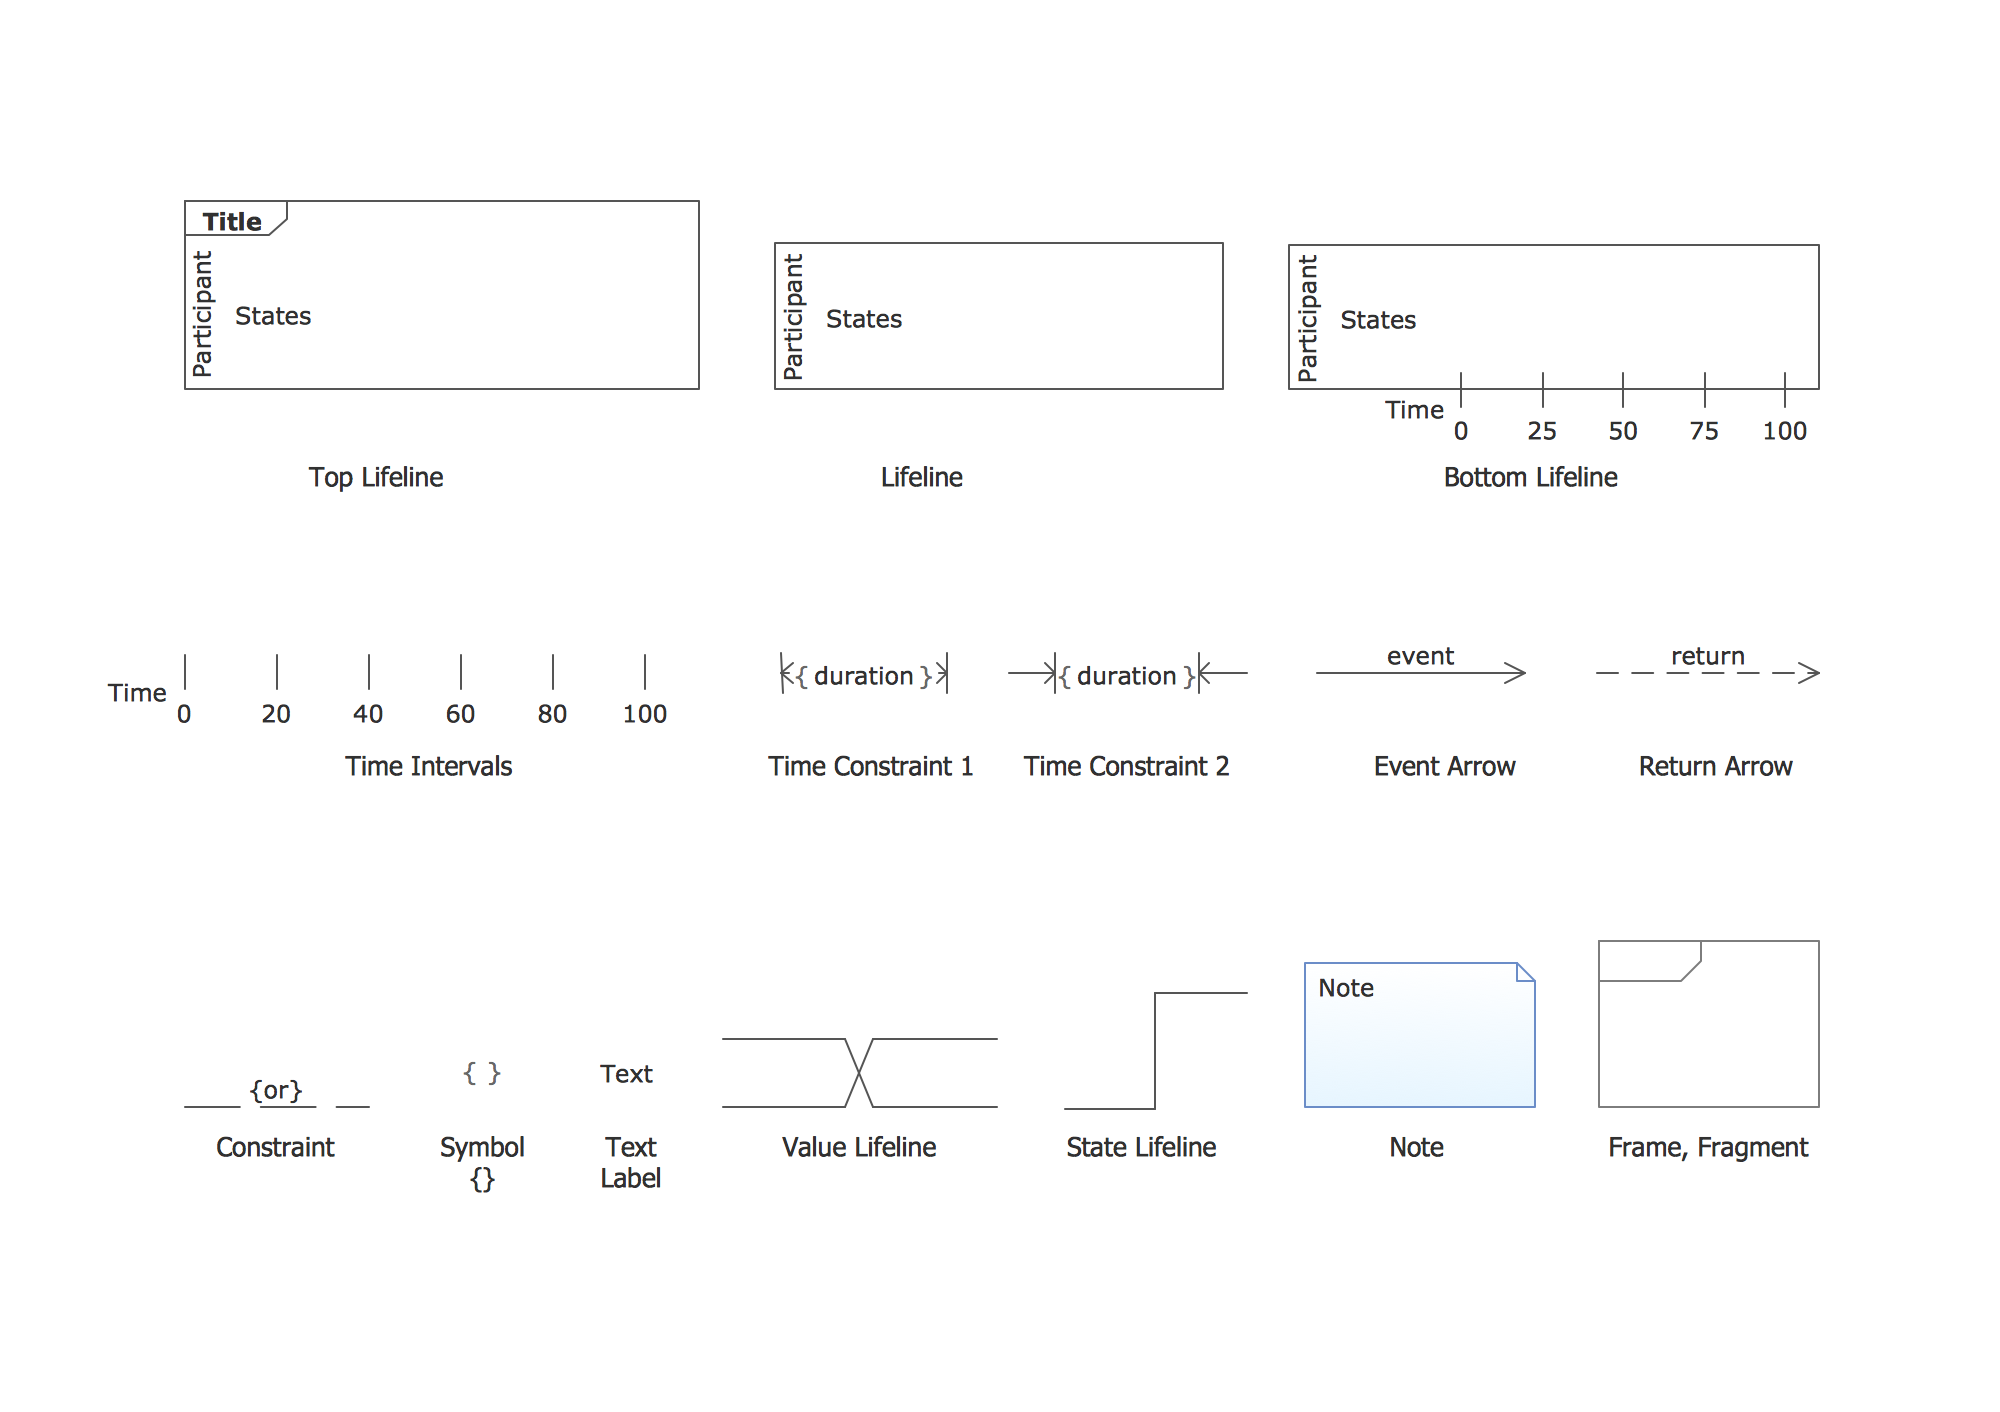
This sample was created in ConceptDraw DIAGRAM diagramming and vector drawing software using the UML Use Case Diagram library of the Rapid UML Solution from the Software Development area of ConceptDraw Solution Park.UML Timing Diagram, Design Elements
UML Timing Diagram as special form of a sequence diagram are used to explore the behaviors of objects throughout a given period of time. ConceptDraw has 393 vector stencils in the 13 libraries that helps you to start using software for designing your own UML Diagrams. You can use the appropriate stencils of UML notation from UML Timing library.- Uml Class Diagram Arrows
- Circular Arrows Diagrams | Circular Arrows | Process Flowchart ...
- IDEF0 standard with ConceptDraw PRO | IDEF3 Standard | UML ...
- Design elements - UML class diagrams | UML Object Diagram ...
- Triangle scheme with arrows - Template | Pyramid diagrams - Vector ...
- UML Class Diagram . Design Elements | Basic Flowchart Symbols ...
- Stakeholder Onion Diagrams | Rapid UML | Intelligence analyst ...
- UML Use Case Diagrams
- Data structure diagram with ConceptDraw PRO | UML Class ...
- UML Component Diagram
- UML Flowchart Symbols | UML Class Diagram Notation | Design ...
- Circular Flow Diagram Template | Circular Arrow | Circular Arrows ...
- UML Class Diagram Example - Buildings and Rooms | How to ...
- Circular diagrams - Vector stencils library | Basic Flowchart Symbols ...
- Fire and Emergency Plans | Emergency Plan | UML Class Diagram ...
- UML Sequence Diagram . Design Elements | UML State Machine ...
- Diagramming Software for designing UML Sequence Diagrams ...
- UML Class Diagram | Credit Card Processing System UML Diagram ...
- Design Elements for UML Diagrams | UML Sequence Diagram ...
- Bank Sequence Diagram | Design Elements for UML Diagrams ...
