 Green Energy
Green Energy solution extends the ConceptDraw DIAGRAM functionality with a large collection of vector design icons, pictograms, and clipart useful to design green energy infographics and illustrations of any kind. Create overview infographics about solar power, wind power, hydropower, tidal power and other renewable and cleaner energy sources. Compare visually different types of energy or data over several years in one chart. Develop detailed infographics about power generation mechanisms, how do solar panels work, wind and tidal turbines, and more specialized power generation equipment.
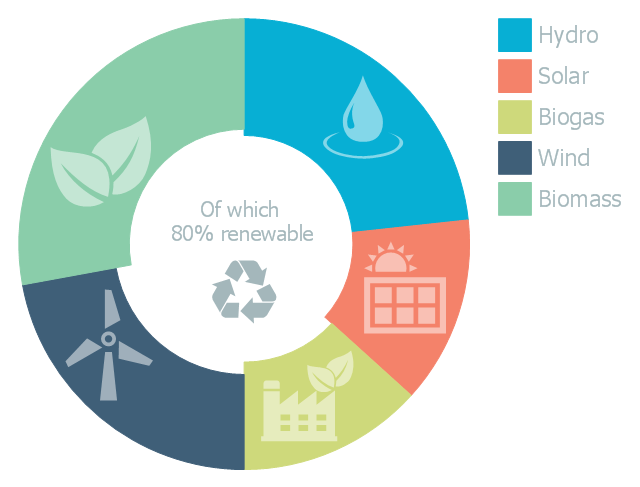
This doughnut chart sample illustrates the renewable energy sources. It was designed on the base of the Wikipedia file: Example of a doughnut chart.png.
[en.wikipedia.org/ wiki/ File:Example_ of_ a_ doughnut_ chart.png]
This file is licensed under the Creative Commons Attribution-ShareAlike 3.0 License. [creativecommons.org/ licenses/ by-sa/ 3.0/ ]
"Renewable energy is generally defined as energy that is collected from resources which are naturally replenished on a human timescale, such as sunlight, wind, rain, tides, waves, and geothermal heat. Renewable energy often provides energy in four important areas: electricity generation, air and water heating/ cooling, transportation, and rural (off-grid) energy services." [Renewable energy. Wikipedia]
The donut chart example "Renewable energy" was created using the ConceptDraw PRO diagramming and vector drawing software extended with the Pie Charts solutiton of the Graphs and Charts area in ConceptDraw Solution Park.
Green Energy
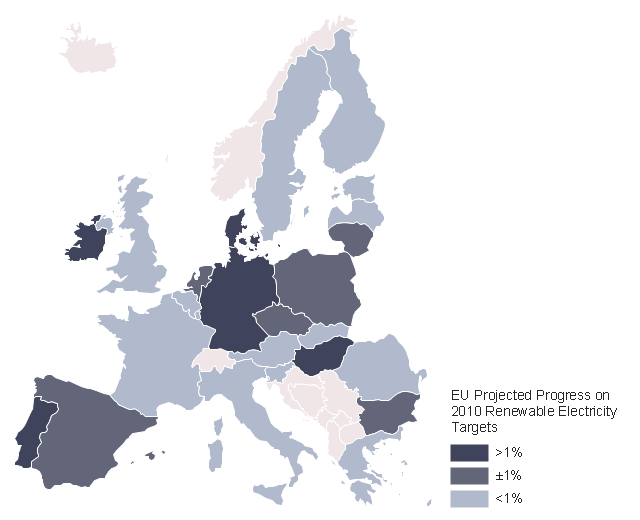
Green energy is the type of energy generated from natural resources most of which are renewable. It is sunlight, wind, water, geothermal heat, tides, rain, biomass. Green energy has great advantages, it is environmentally friendly, doesn’t harm nature and climate. There is no release of greenhouse gases into the atmosphere at its use. The Sustainable Development solution for ConceptDraw DIAGRAM software includes samples and libraries of vector design stencils for creating illustrative and professional-looking diagrams and infographics to show green energy sources, their advantages, efficiency, costs, and wastes.This example was created on the base of thematic map "2009 EU Renewable Electricity Share" from the article "European Union countries reach for higher renewable electricity generation" on the website of U.S. Energy Information Administration (EIA).
"Renewable generation includes hydropower, biomass, wind, solar, and geothermal. Nuclear power is not included." [www.eia.gov/ todayinenergy/ detail.cfm?id=2530]
"The countries of the European Union are the number two global leaders in the development and application of renewable energy. Promoting the use of renewable energy sources is important both to the reduction of the EU's dependence on foreign energy imports, and in meeting targets to combat global warming." [Renewable energy in the European Union. Wikipedia]
The thematic map example "EU countries map - Renewable electricity generation" was designed using the ConceptDraw PRO software extended with the Map of Germany solution from the Maps area of ConceptDraw Solution Park.
 Energy Industry Infographics
Energy Industry Infographics solution is ideal for designing energy-related business infographics, diagrams, charts, illustrations for documents and presentations. It provides a set of libraries with special vector energy industry symbols, icons for electrical power industry, nuclear power industry, fossil fuel industry, and renewable energy industry, energy icons of fuel gas, liquid fuel, solid fuel, industry icons of electrical substations, power plants. Collection of samples including nuclear fuel cycle and energy distribution schematics, electrical substation diagram, energy intelligence dashboard, electricity grid schematics, and many more is also included. This solution is indispensable for all engineers, chefs, managers, marketers, and other professionals working in energy industry.
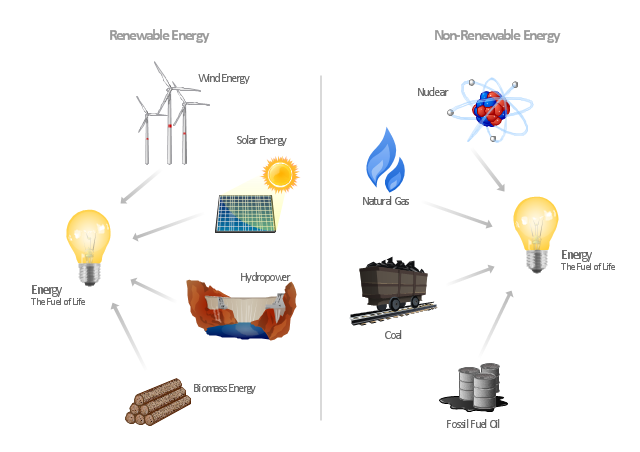
"Consumption of energy resources, (e.g. turning on a light) requires resources and has an effect on the environment. Many electric power plants burn coal, oil or natural gas in order to generate electricity for energy needs. While burning these fossil fuels produces a readily available and instantaneous supply of electricity, it also generates air pollutants including carbon dioxide (CO2), sulfur dioxide and trioxide (SOx) and nitrogen oxides (NOx). Carbon dioxide is an important greenhouse gas which is thought to be responsible for some fraction of the rapid increase in global warming seen especially in the temperature records in the 20th century, as compared with tens of thousands of years worth of temperature records which can be read from ice cores taken in Arctic regions. Burning fossil fuels for electricity generation also releases trace metals such as beryllium, cadmium, chromium, copper, manganese, mercury, nickel, and silver into the environment, which also act as pollutants.
The large-scale use of renewable energy technologies would "greatly mitigate or eliminate a wide range of environmental and human health impacts of energy use". Renewable energy technologies include biofuels, solar heating and cooling, hydroelectric power, solar power, and wind power. Energy conservation and the efficient use of energy would also help." [Energy industry. Environmental impact. Wikipedia]
The Energy resources diagram example was created in the ConceptDraw PRO diagramming and vector drawing software using the Manufacturing and Maintenance solution from the Illustration area of ConceptDraw Solution Park.
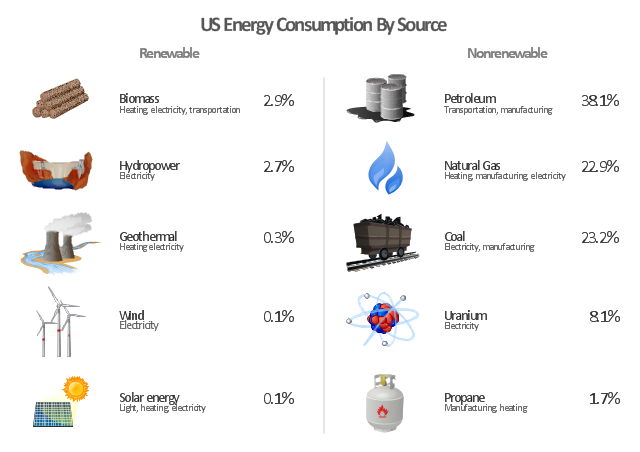
"The United States is the 800th largest energy consumer in terms of total use in 2010. ...
The majority of this energy is derived from fossil fuels: in 2010, data showed 25% of the nation's energy came from petroleum, 22% from coal, and 22% from natural gas. Nuclear power supplied 8.4% and renewable energy supplied 8%, which was mainly from hydroelectric dams although other renewables are included such as wind power, geothermal and solar energy." [Energy in the United States. Wikipedia]
The infographics example "U.S. energy consumption by source" was created in the ConceptDraw PRO diagramming and vector drawing software using the Manufacturing and Maintenance solution from the Illustration area of ConceptDraw Solution Park.
 Environmental, Social, and Corporate Governance
The Environmental, Social, and Corporate Governance solution with diversity of drawing tools, libraries of pre-made vector elements, and thematic samples is the best to illustrate the key points of ESG, specify ESG criteria and ESG risks. This helps investors evaluate potential investments and avoid investment losses. Outline ESG factors and ESG standards to protect the environment, avoid climate change and biodiversity loss, illustrate principles of sustainability, waste management, supply chain management, and the importance of the use of renewable energy and renewable resources. Depict easily the policies of the companies that adhere to ESG standards.
Hydropower
Hydropower is energy derived from flowing, falling, or fast-running water to produce electricity by driving turbines. It is one of the most cost-effective ways to generate electricity. Hydroelectric power plants are usually located near a water source or on it. ConceptDraw DIAGRAM vector design software provides the Green Energy solution with Hydropower library including a set of thematic vector design elements. It is the best assistant to design diagrams and infographics about hydropower, show the advantages of using this kind of power.Tidal Power
Tidal power is a kind of energy produced by the natural rise and fall of ocean tides and currents. These tides are caused by the gravitational interaction between the Earth, the sun, and the moon. Succeed in designing visual infographics and diagrams about tidal power using ConceptDraw's Green Energy solution and Tidal Power library with a large variety of thematic vector design elements. This solution helps to make an overview of all variety of renewable resources, their advantages, and achievements from their use.How Do Solar Panels Work
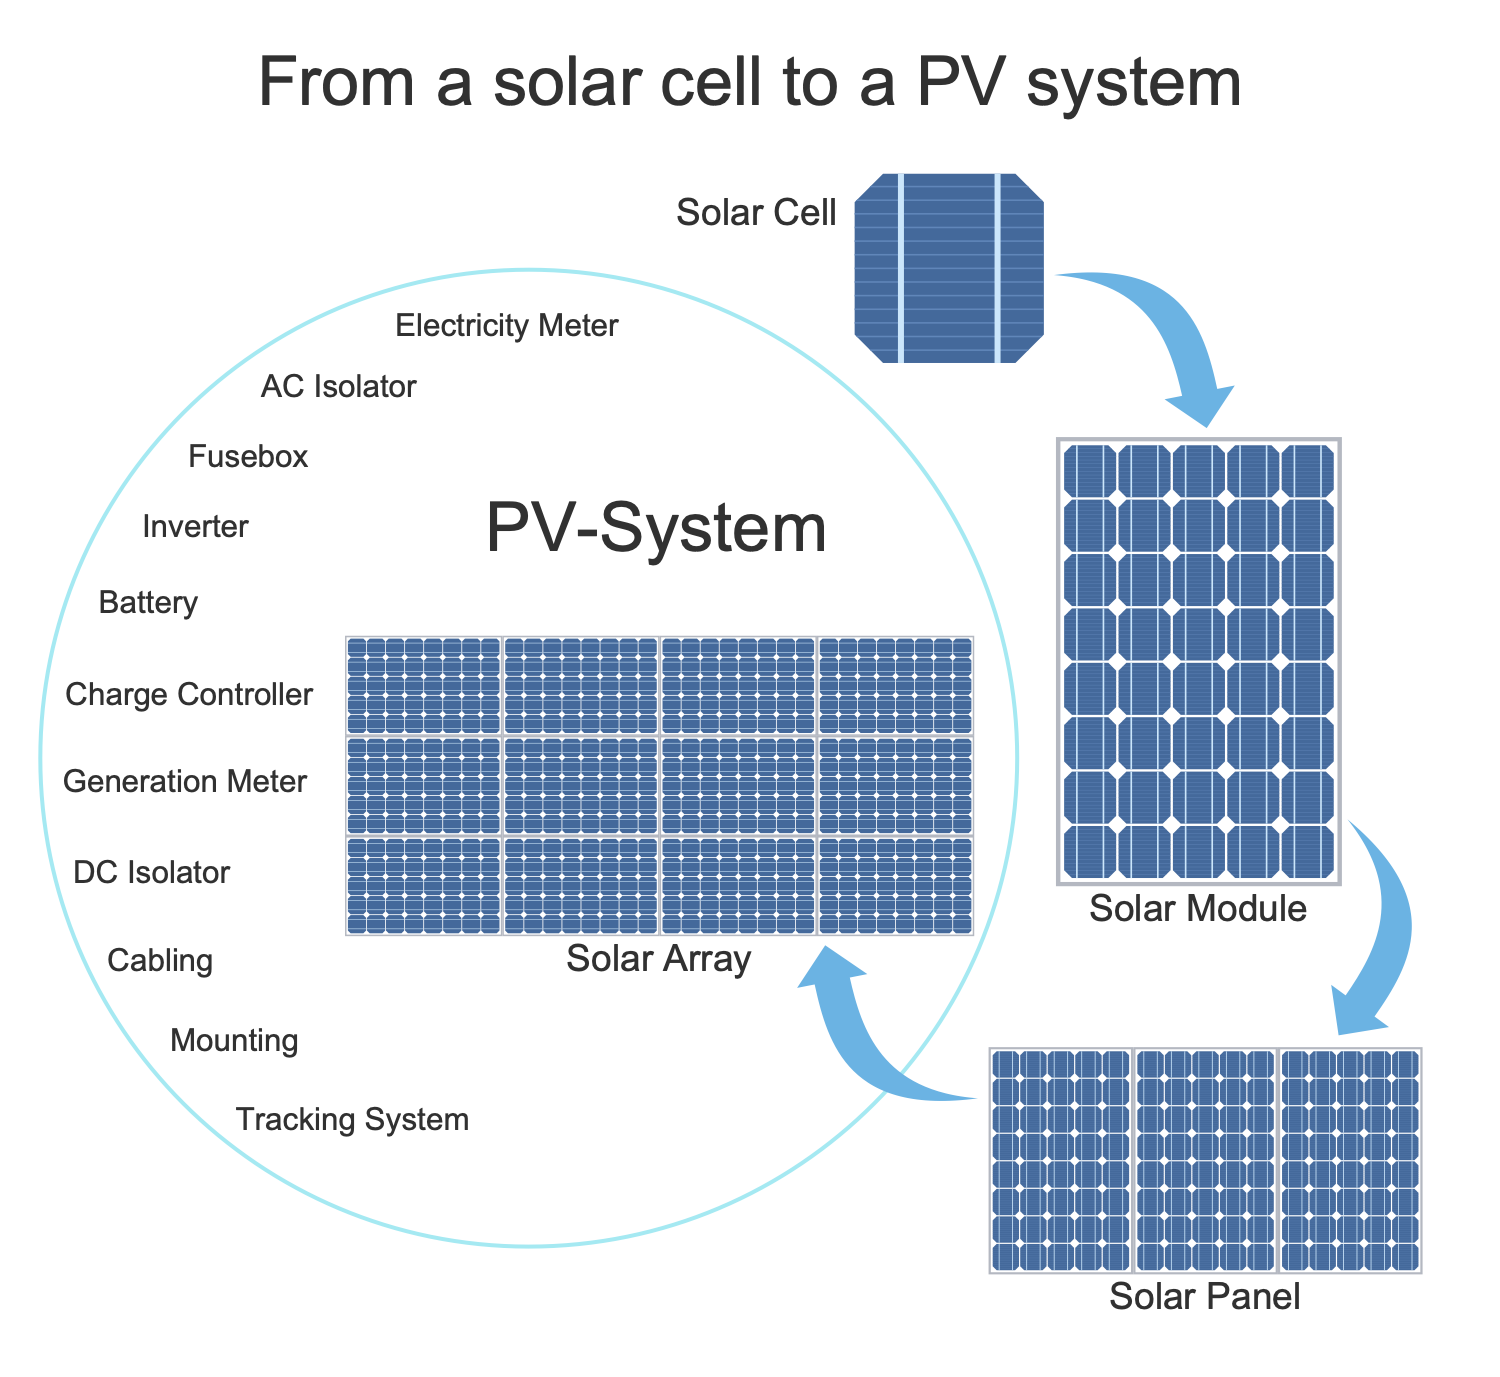
Solar panels are developed to convert sunlight into a useful form of energy - electrical energy. They use photovoltaic (PV) panels or mirrors concentrating solar radiation and are installed on rooftops and wide areas forming solar farms. ConceptDraw DIAGRAM software extended with the Green Energy solution is ideal for designing illustrations and infographics about clean and environmentally friendly solar power, solar panels, their types and features. Illustrate how do solar panels work, the transition from a solar cell to a PV system, and other issues using the design elements from the solution's Solar Power library and successfully use the resulting infographics in work and private life.
 Internet of Things
The Internet of Things solution extends ConceptDraw DIAGRAM with a set of samples and a wide collection of predesigned special clipart, pictograms, and symbols of IoT sensors, IoT devices, smart appliances, retail, industrial, and agricultural IoT devices, and many other IoT objects. This solution is incredibly helpful for designing the Internet of Things (IoT) and Web of Things (WoT) diagrams and infographics of different complexity for numerous areas and industries. It is incredibly useful for engineers, designers, electricians, mechanics, developers, technicians, electronics, and safety-related specialists.
Smart City
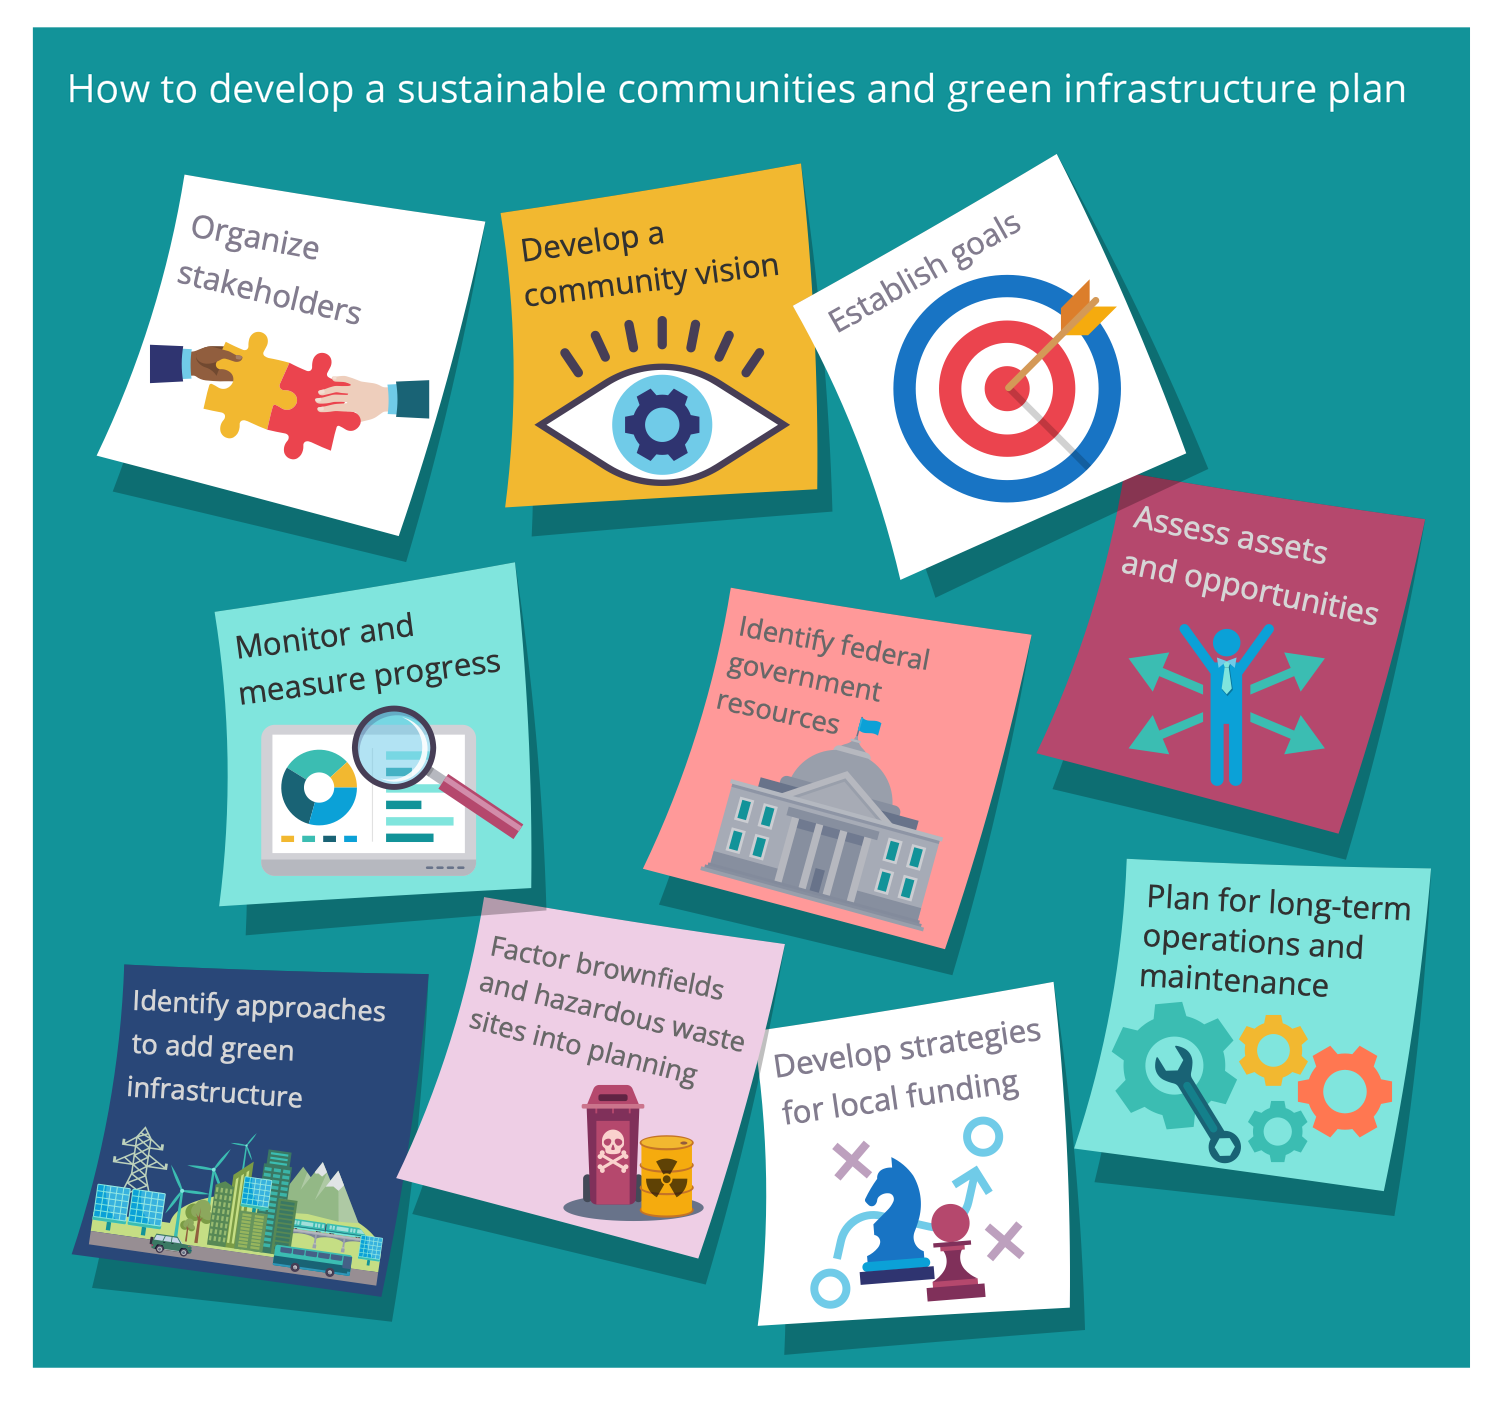
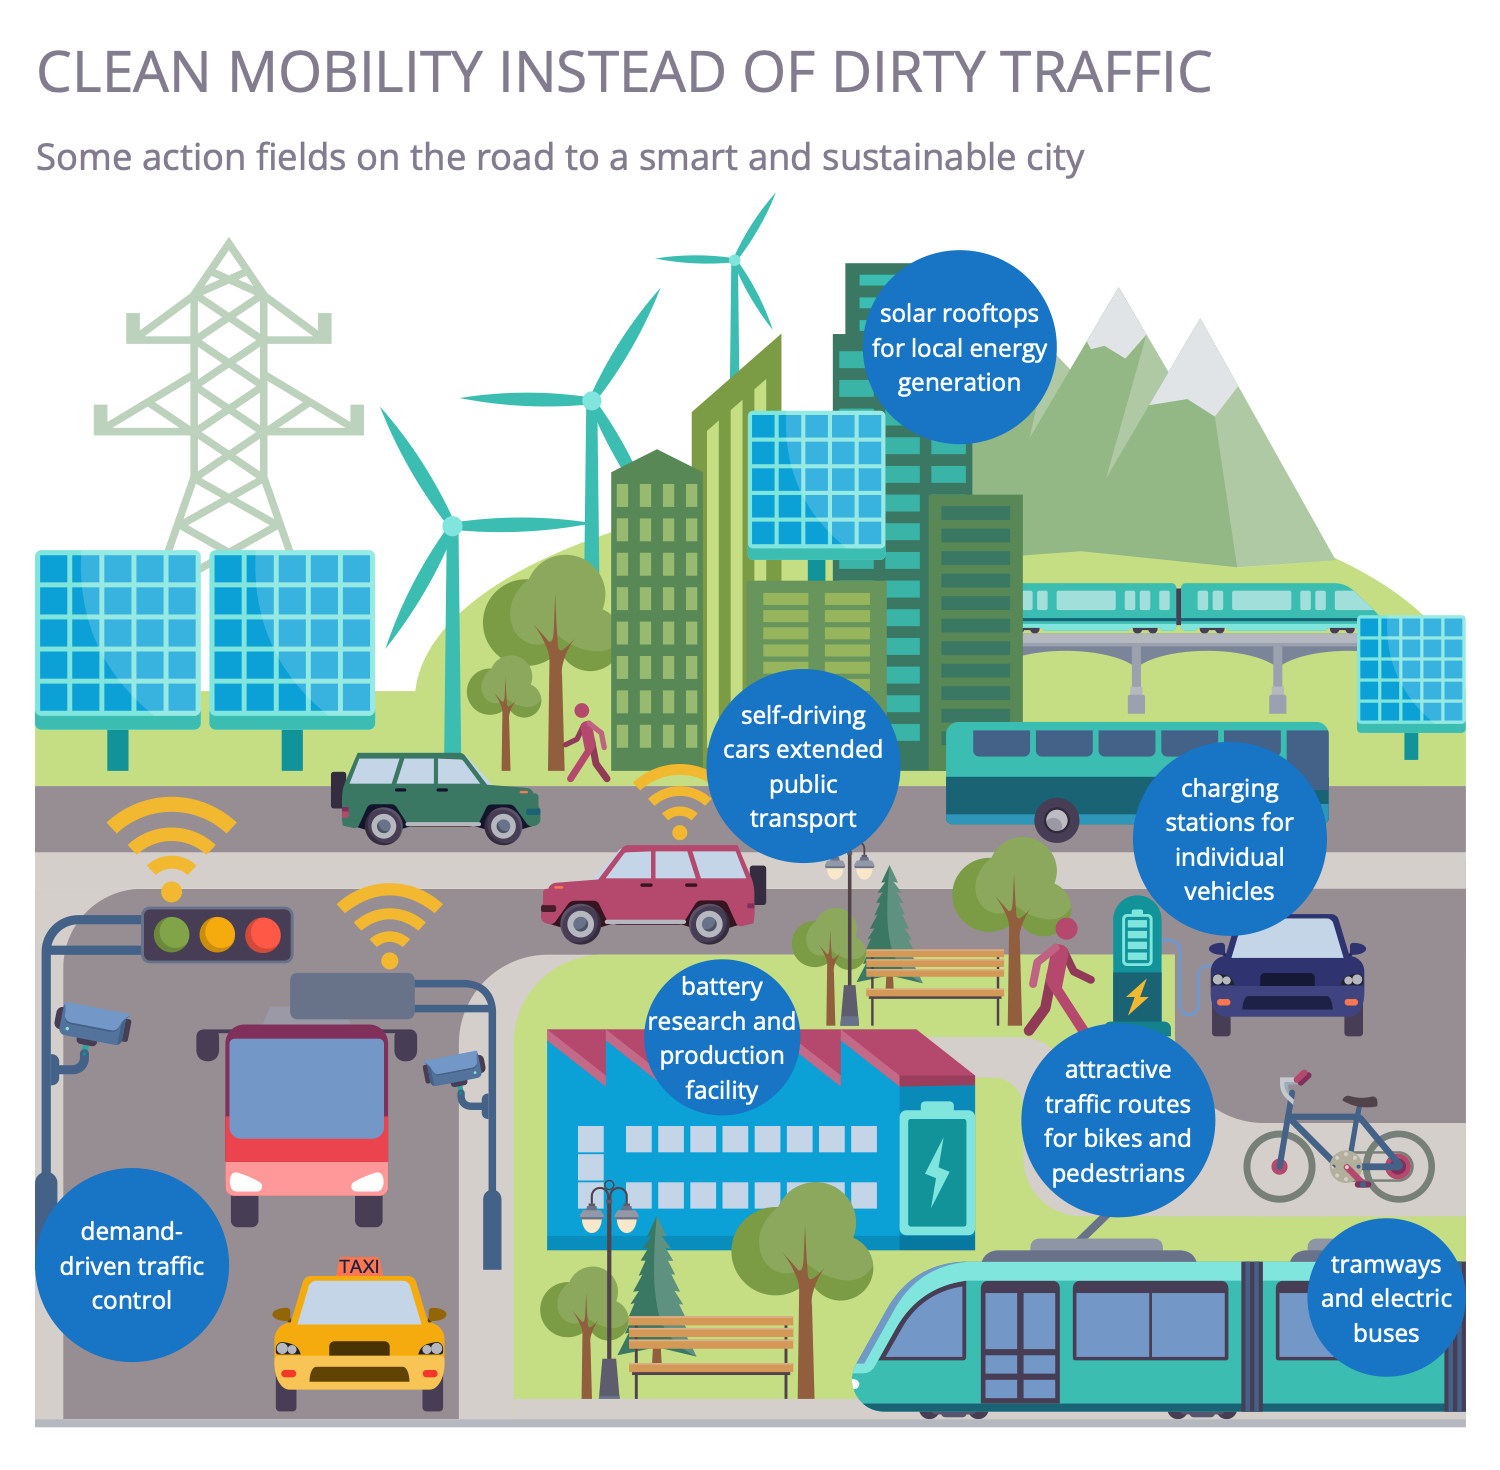
The introduction of smart technologies is economically and ecologically beneficial. New technologies drive the evolution of smart cities - technologically modern and environment-friendly cities. Their infrastructure and services are ecological, efficient, accessible to all, and ensure a high quality of life for inhabitants. Sustainable Development solution includes special and commonly recognized symbols, clipart, and pictograms useful to create a plan for a sustainable city no matter small or large size in minutes, outline visually the steps to be implemented, set timelines and deadlines.
 Sustainable Development
The Sustainable Development solution extends ConceptDraw DIAGRAM with a set of pre-made samples and a large collection of predesigned objects, symbols, and pictograms for designing professionally looking diagrams related to sustainable development, its processes, goals, methods, and ways for their achievement. This solution is really helpful to create schematics and designs illustrating the main points of sustainable development, social sustainability, narrating about sustainable energy and sources of green energy. It is useful to develop sustainable development plans that need to be implemented to ensure the safety of nature, list the UN sustainable development goals, draw up a plan for building a smart city and implementing the principles of sustainable agriculture, and other important information.
 ConceptDraw Solution Park
ConceptDraw Solution Park collects graphic extensions, examples and learning materials
 Manufacturing and Maintenance
Manufacturing and maintenance solution extends ConceptDraw DIAGRAM software with illustration samples, templates and vector stencils libraries with clip art of packaging systems, industrial vehicles, tools, resources and energy.
- Pie Charts | Energy resources diagram | Renewable Energy Png
- Pie Charts | Renewable energy | Divided Bar Diagrams | Renewable ...
- EU countries map - Renewable electricity generation | Pie Charts ...
- Renewable energy | Design elements - Ecology pictograms ...
- Renewable energy | Pie Charts | Electrical Symbols — Power Sources
- Renewable energy | Scrum workspace | Recycle Chart Image
- Renewable energy | Resources and energy - Vector stencils library ...
- Pie Charts | Divided Bar Diagrams | Visio Stencil Renewable Energy
- Pie Charts | Renewable Energy Detailed Flow Diagram
- U.S. energy consumption by source | Pie Charts | Design elements ...
