The vector stencils library "Time and clock pictograms" contains 20 time pictograms: clocks, calendars, day, week, bell, alarm clock, hourglass, wristwatch, and time intervals symbols.
Use it to create temporal infographic, illustrations and diagrams.
The example "Time and clock pictograms - Vector stencils library" was created using the ConceptDraw PRO diagramming and vector drawing software extended with the Pictorial infographics solution from the area "What is infographics" in ConceptDraw Solution Park.
Time
Stopwatch

Stopwatch 15"
Stopwatch 30"
Stopwatch 45"
24 h
7 d
Circle clock

Clock time

Time o'clock
Time - quarter past

Time - half past

Time - quarter to

Full time

Calendar

Current date

Hourglass

Wristwatch

Alarm clock

Bell

The vector stencils library "Time and clock pictograms" contains 20 time pictograms: clocks, calendars, day, week, bell, alarm clock, hourglass, wristwatch, and time intervals symbols.
Use it to create temporal infographic, illustrations and diagrams.
The example "Time and clock pictograms - Vector stencils library" was created using the ConceptDraw PRO diagramming and vector drawing software extended with the Pictorial infographics solution from the area "What is infographics" in ConceptDraw Solution Park.
Use it to create temporal infographic, illustrations and diagrams.
The example "Time and clock pictograms - Vector stencils library" was created using the ConceptDraw PRO diagramming and vector drawing software extended with the Pictorial infographics solution from the area "What is infographics" in ConceptDraw Solution Park.
Time
Stopwatch
Stopwatch 15"
Stopwatch 30"
Stopwatch 45"
24 h
7 d
Circle clock
Clock time
Time o'clock
Time - quarter past
Time - half past
Time - quarter to
Full time
Calendar
Current date
Hourglass
Wristwatch
Alarm clock
Bell
The vector stencils library "Time" contains 20 time and clock icons.
Use it to design your business and finance illustrations and infographics with ConceptDraw PRO diagramming and vector drawing software.
The vector stencils library "Time" is included in the Business and Finance solution from the Illustration area of ConceptDraw Solution Park.
Use it to design your business and finance illustrations and infographics with ConceptDraw PRO diagramming and vector drawing software.
The vector stencils library "Time" is included in the Business and Finance solution from the Illustration area of ConceptDraw Solution Park.
Wall clock

Alarm clock

Electronic clock
Dual watch

Sand glass
Tower clock

Stopwatch

Metronome

Working time

Rest time

Waiting time
Dinner time

Coming late

Coming in time

Time management

Morning

Afternoon

Evening

Night

Around the clock

Time - Design Elements

The vector stencils library "Time" contains 20 time and clock icons.
Use it to design your business and finance illustrations and infographics with ConceptDraw PRO diagramming and vector drawing software.
"Time management is the act or process of planning and exercising conscious control over the amount of time spent on specific activities, especially to increase effectiveness, efficiency or productivity.
It is a meta-activity with the goal to maximize the overall benefit of a set of other activities within the boundary condition of a limited amount of time.
Time management may be aided by a range of skills, tools, and techniques used to manage time when accomplishing specific tasks, projects, and goals complying with a due date." [Time management. Wikipedia]
The icon set example "Design elements - Time" is included in the Business and Finance solution from Illustration area of ConceptDraw Solution Park.
Icon set
The vector stencils library "Workflow management" contains 22 icons.
Use it to design your business process workflow diagrams with ConceptDraw PRO software.
"Management in businesses and organizations is the function that coordinates the efforts of people to accomplish goals and objectives by using available resources efficiently and effectively.
Management includes planning, organizing, staffing, leading or directing, and controlling an organization to accomplish the goal or target. Resourcing encompasses the deployment and manipulation of human resources, financial resources, technological resources, and natural resources." [Management. Wikipedia]
The icons example "Design elements - Workflow management" is included in the Business Process Workflow Diagrams solution from the Business Processes area of ConceptDraw Solution Park.
Management icons
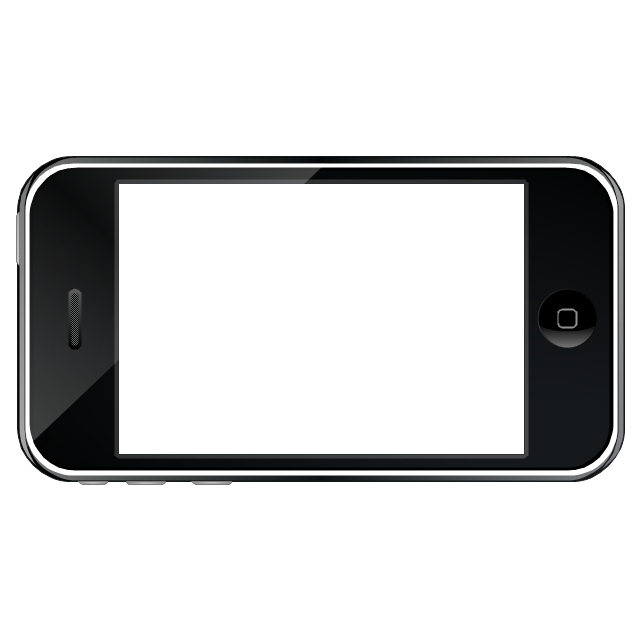
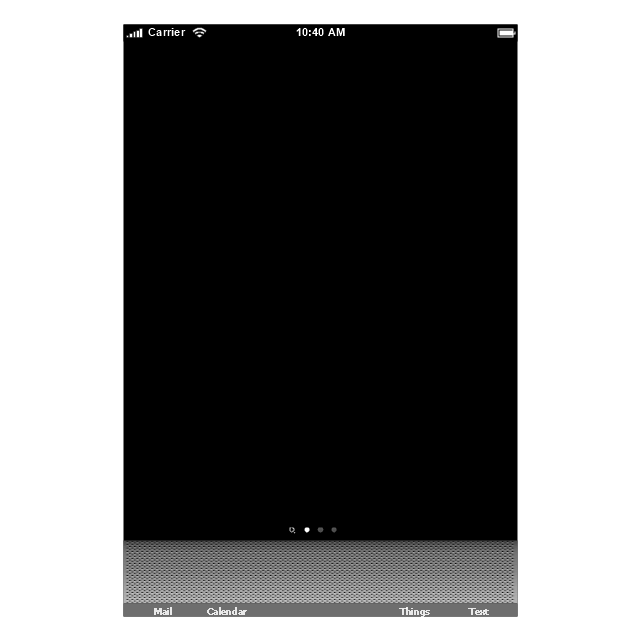
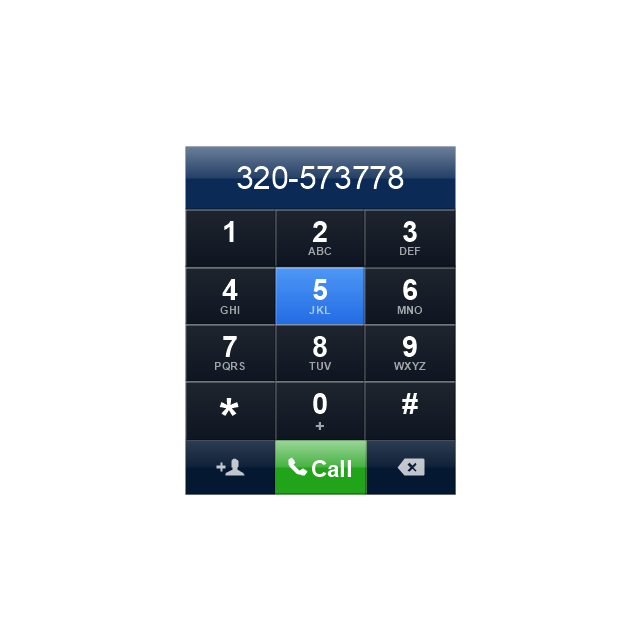
The vector stencils library "iPhone interface" contains 119 iPhone UI design elements.
Use it for development of graphic user interface (GUI) for iPhone software applications in the ConceptDraw PRO diagramming and vector drawing software extended with the Graphic User Interface solution from the Software Development area of ConceptDraw Solution Park.
Use it for development of graphic user interface (GUI) for iPhone software applications in the ConceptDraw PRO diagramming and vector drawing software extended with the Graphic User Interface solution from the Software Development area of ConceptDraw Solution Park.
iPhone case
iPhone case, horizontal
Display
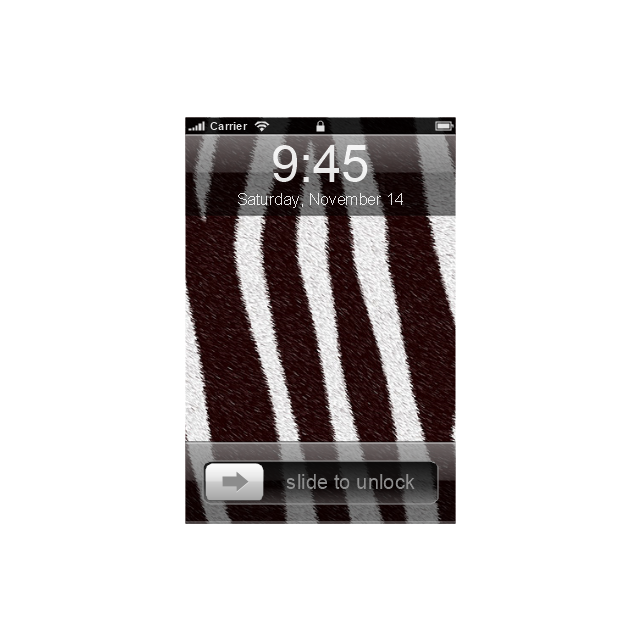
Screen

Home screen
Keypad control
Status bar
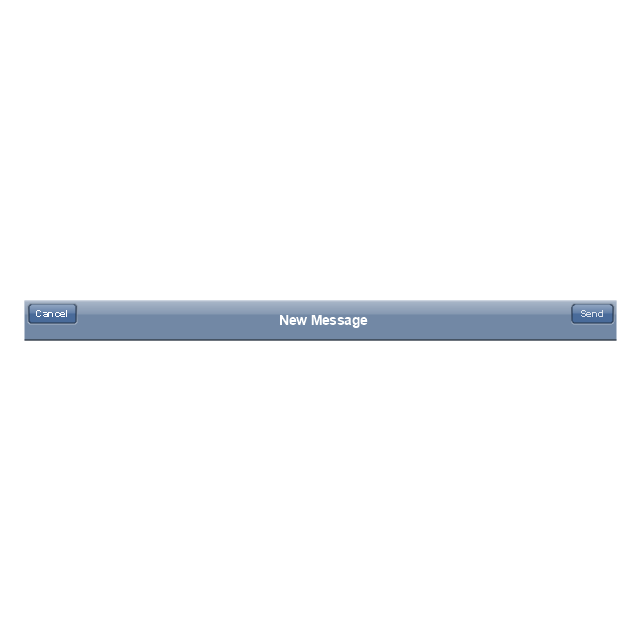
Navigation bar

Navigation bar with buttons

Navigation bar with controls
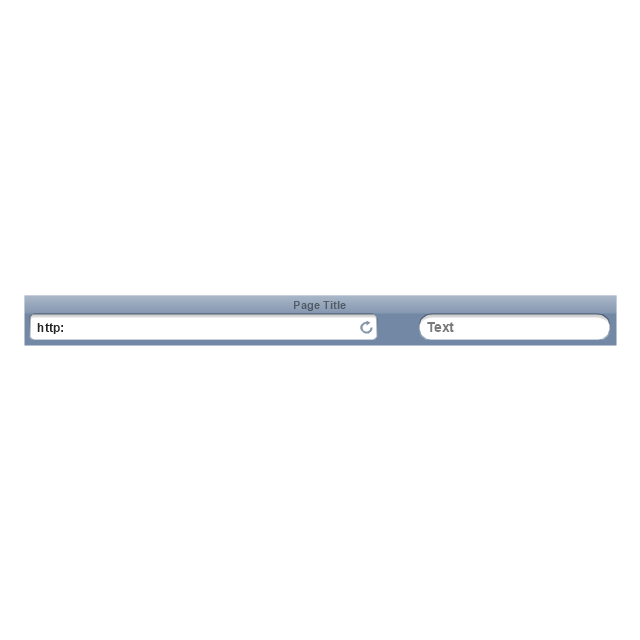
Navigation bar with controls
Navigation bar with buttons, horizontal
Navigation bar with controls, horizontal
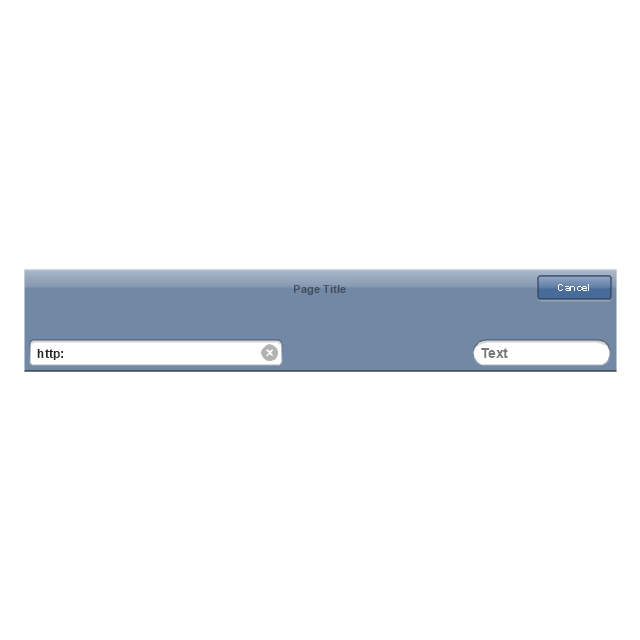
Modal view
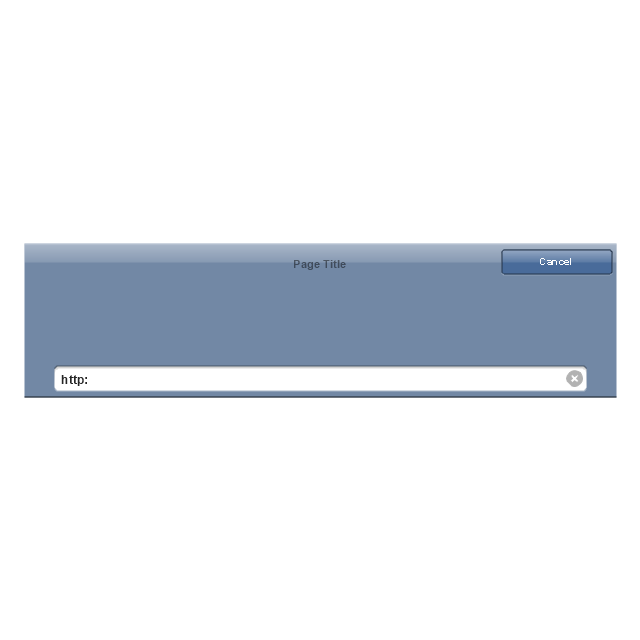
Search bar
Text field 1

Text field 2

Text field, varying
Table row
Table view row
Table view (simple list)
-iphone-interface---vector-stencils-library.png--diagram-flowchart-example.png)
Table view (with header)
-iphone-interface---vector-stencils-library.png--diagram-flowchart-example.png)
Action list
Control button

Navigational control button

Add button

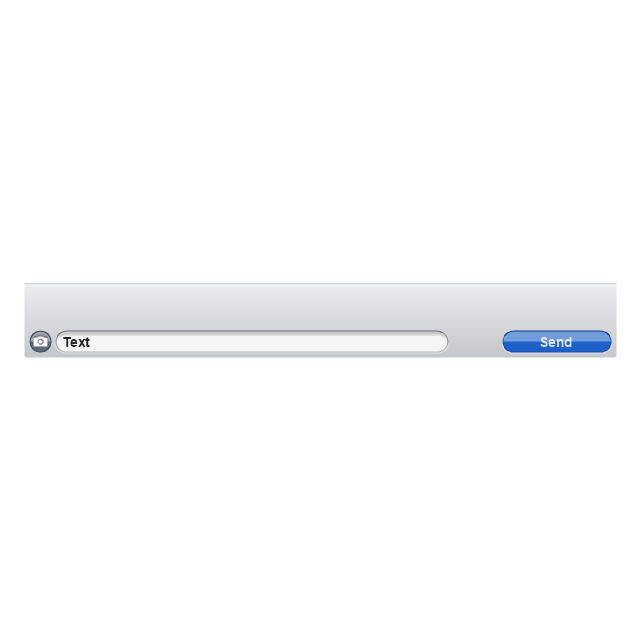
Navigation toolbar

Tab bar

Action sheet

Choice button

Rounded rectangle button
Keyboard control
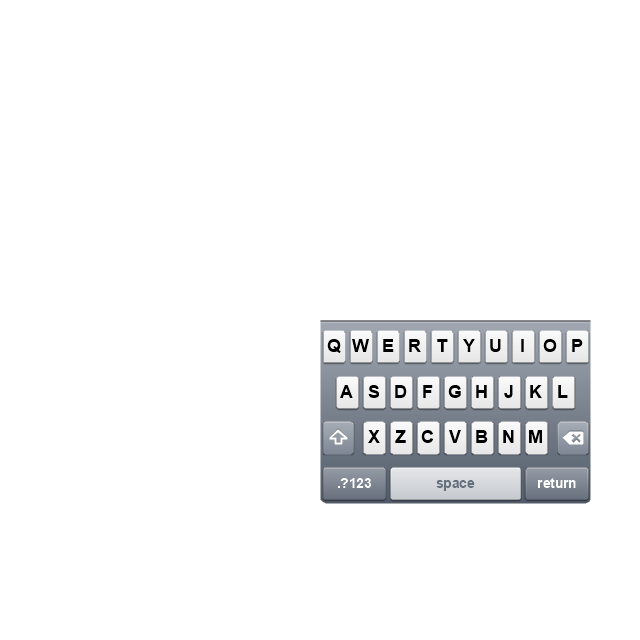
Keyboard literal button
Keyboard button, pressed
Keyboard label button

Selection frame 1

Selection frame 2

Loupe

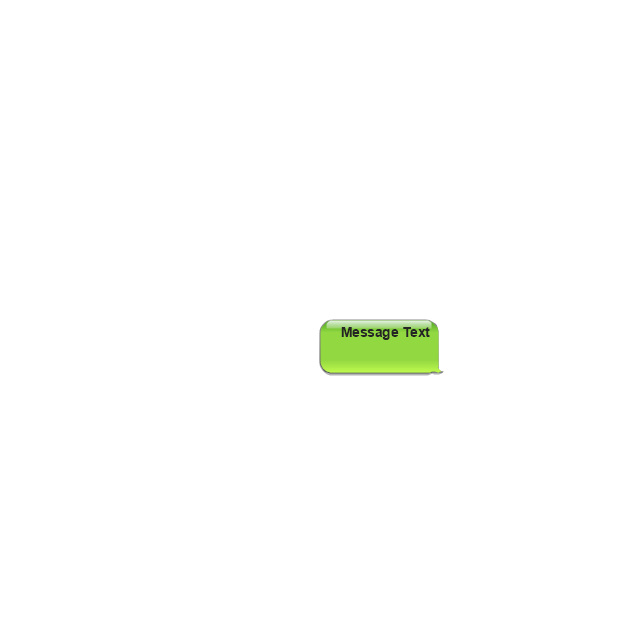
Message box 1
Message box 2
Progress view

Progress view

Progress view

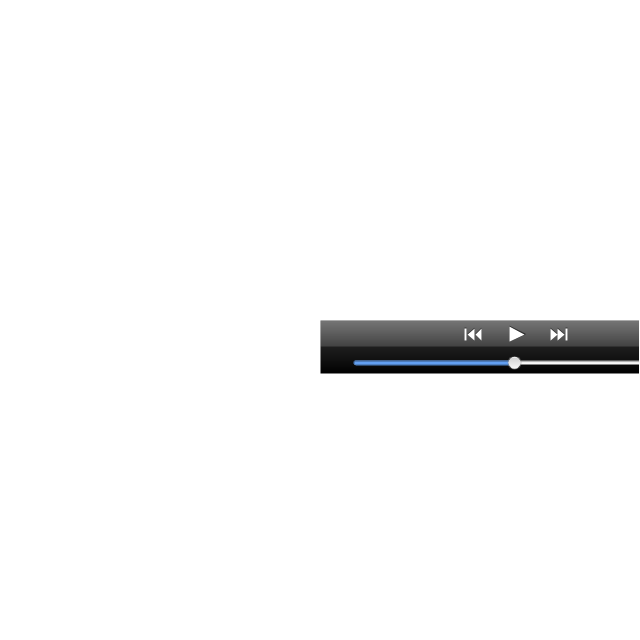
Player control
Label button

Back button

Forward button

Option button
Checkbox

Radio button

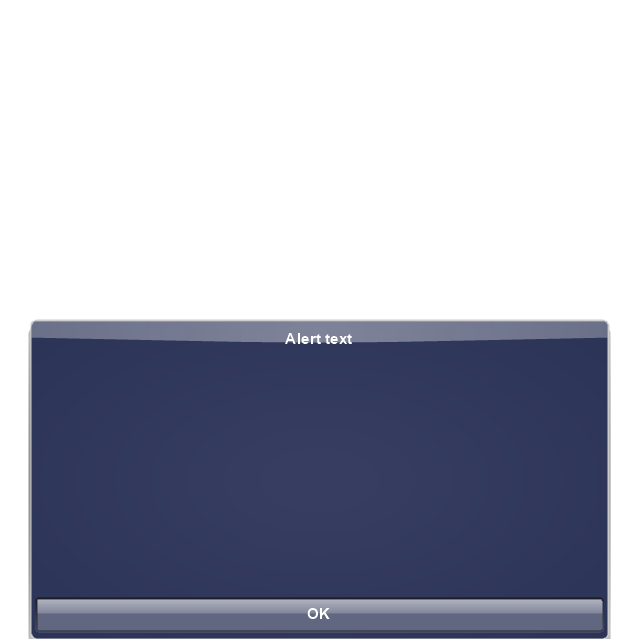
Alert
Two-button alert
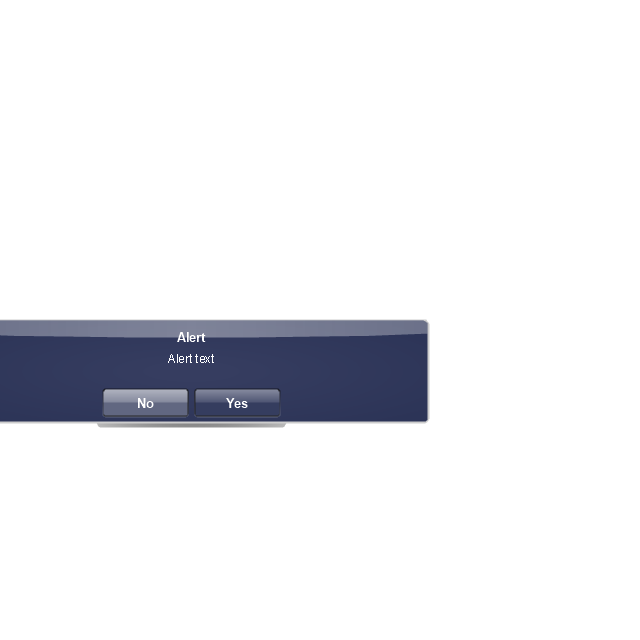
Two-button alert (v 3.0)
-iphone-interface---vector-stencils-library.png--diagram-flowchart-example.png)
Up-Down control

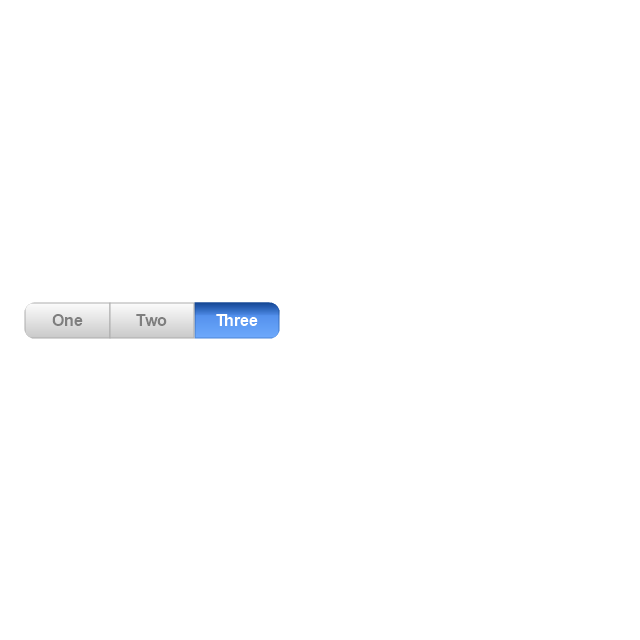
Segmented control

Segmented control

Segmented control
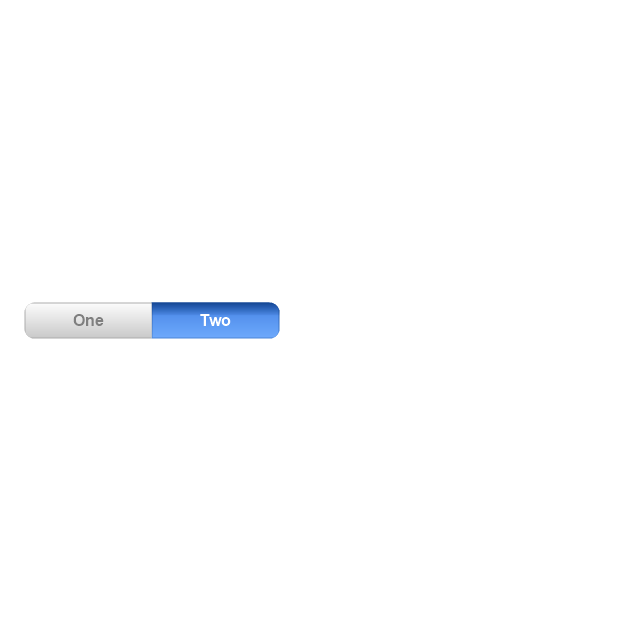
Segmented control
Pop-up menu button

Popup menu

Clock, white

Clock, black

Clock application table

Date and time picker (1/2 parts)
-iphone-interface---vector-stencils-library.png--diagram-flowchart-example.png)
Date and time picker (3 parts)
-iphone-interface---vector-stencils-library.png--diagram-flowchart-example.png)
Date and time picker (4 parts)
-iphone-interface---vector-stencils-library.png--diagram-flowchart-example.png)
Date and time picker (v 3.0)
-iphone-interface---vector-stencils-library.png--diagram-flowchart-example.png)
Switch control

System button

Reply button

Organize button

Remove button

Refresh button

Play button

FastForward button

Pause button

Rewind button

Backward icon
Forward icon
Share button

Camera button

Compose button

Bookmarks button

Search button

Add button

Trash button

Bookmarks tab icon
Contacts tab icon
Downloads tab icon
Favorites tab icon
Featured tab icon
History tab icon
MostRecent tab icon
MostViewed tab icon
Search tab icon
More tab icon
SMS tab icon
Mail tab icon
Charts tab icon
World clock tab icon
Alarm tab icon
Stopwatch tab icon
Timer tab icon
Badge
Delete button control

Checkmark

Delete button

Insert

Disclosure indicator

Clear button

Bookmarks badge
Badge with varying width 1
Badge with varying width 2
Badge with varying width 3
Activity indicator

Network activity indicator

Page control

Search badge
Slider

How to Draw Pictorial Chart. How to Use Infograms

This cycle process chart was redesigned from the Wikimedia Commons file: Business Feedback Loop PNG version.png.
"A business ideally is continually seeking feedback from customers: are the products helpful? are their needs being met? Constructive criticism helps marketers adjust offerings to meet customer needs."
[commons.wikimedia.org/ wiki/ File:Business_ Feedback_ Loop_ PNG_ version.png]
The cycle process diagram example "Business feedback loop" was created using the ConceptDraw PRO diagramming and vector drawing software extended with the Sales Flowcharts solution from the Marketing area of ConceptDraw Solution Park.
Customers feedback cycle process chart

Design Pictorial Infographics. Design Infographics

Electrical Symbols — Analog and Digital Logic

This cycle process chart was redesigned from the Wikimedia Commons file: Business Feedback Loop PNG version.png.
"A business ideally is continually seeking feedback from customers: are the products helpful? are their needs being met? Constructive criticism helps marketers adjust offerings to meet customer needs."
[commons.wikimedia.org/ wiki/ File:Business_ Feedback_ Loop_ PNG_ version.png]
The cycle process diagram example "Business feedback loop" was created using the ConceptDraw PRO diagramming and vector drawing software extended with the Sales Flowcharts solution from the Marketing area of ConceptDraw Solution Park.
"A business ideally is continually seeking feedback from customers: are the products helpful? are their needs being met? Constructive criticism helps marketers adjust offerings to meet customer needs."
[commons.wikimedia.org/ wiki/ File:Business_ Feedback_ Loop_ PNG_ version.png]
The cycle process diagram example "Business feedback loop" was created using the ConceptDraw PRO diagramming and vector drawing software extended with the Sales Flowcharts solution from the Marketing area of ConceptDraw Solution Park.
Customers feedback cycle process chart
The vector clipart library "Presentation design elements" contains 45 presentation symbols and arrows which you can easy use in your slides and illustrations.
"A presentation is the process of presenting a topic to an audience. It is typically a demonstration, lecture, or speech meant to inform, persuade, or build good will. ... the use of visuals reduced meeting times... audiences believe presenters who use visuals are more professional and credible than presenters who merely speak. ... meetings and presentations reinforced with visuals help participants reach decisions and consensus more quickly." [Presentation. Wikipedia]
The clip art example "Presentation design elements - Vector clipart library" was created in the ConceptDraw PRO diagramming and vector drawing software using the Presentation Clipart solution from the Illustration area of ConceptDraw Solution Park.
Advance Direction Sign

Circuit

Growth

Master Link

Comparison

Plus

Minus

Multiplication

Division

Loupe

Plus sign

Minus sign

Pros and Cons

Balance Lever

Balance

Scientific Research

Business People

Hand

Financial Growth

Wallet

Increase

Decrease

Clock

Mechanism

Interaction

Small Company

Big Company

Company Expansion

Foreign Market Entry

Time

Close Cooperation

Company

Company Merger

Company Extension

Foreign Market Penetration

Business Relations

Profits

Frame 1

Frame 2

Background 1

Background 2

Background 3

Background 4

Background 5

Title block

Pictorial Chart

Infographic Maker

- 24 Hours Vector Logo
- Logo Clock Png
- Time Logo Png
- Working Time Logo
- Logo Eco Vector
- Iphone 7 Message App Logo
- Logo Call Iphone 6 Png
- Banquet Hall Plan Software | Presentation design elements - Vector ...
- Shopping Logo
- Logo App Photos Iphone Png
- Loupe Logo
- Logo Passbook Iphone
- Iphone 6 Apps Logo Camera
- ABC - Vector stencils library | Aquaman Logo Vector
- Amex Card Logo Vector
- App Store Logo Vector
- Iphone Messages Logo Hd Png
- Logo Clock Iphone
- Logo App Store Vector
- Iphone Icon Logo