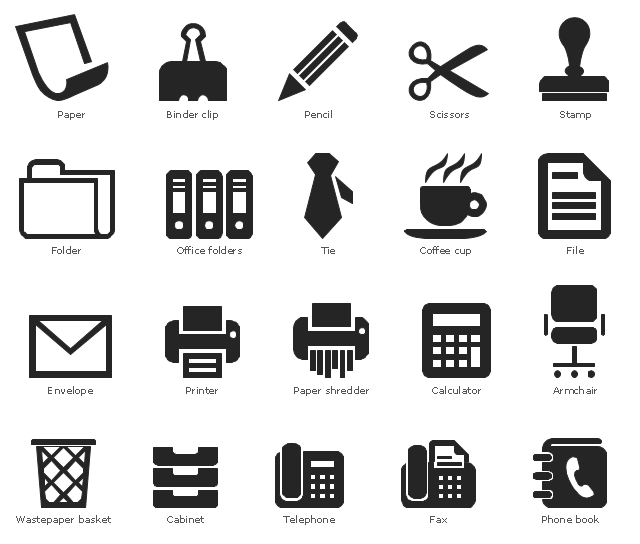
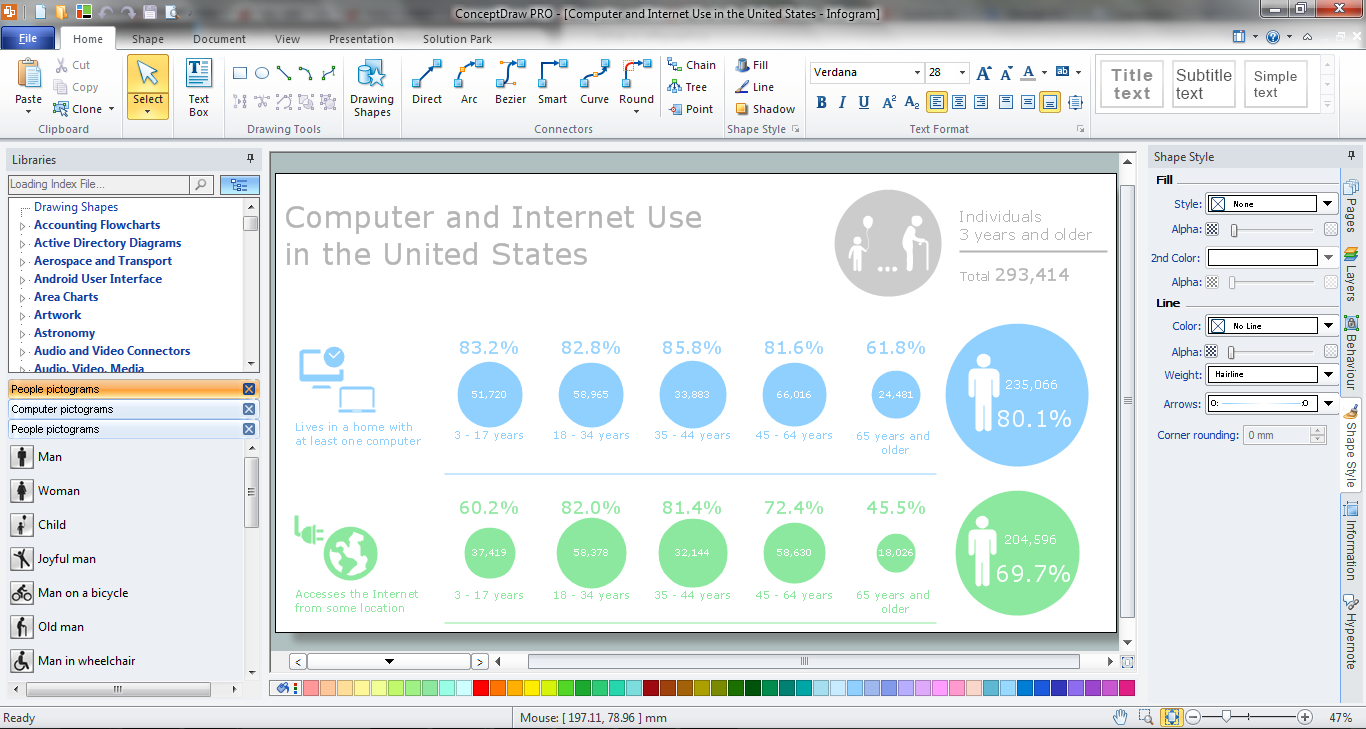
The vector stencils library "Office pictograms" contains 20 icons of office symbols, stationery, office supplies, writing implement, writing instruments. Use it to draw your business infographics. The example "Office pictograms - Vector stencils library" was created using the ConceptDraw PRO diagramming and vector drawing software extended with the Pictorial infographics solution from the area "What is infographics" in ConceptDraw Solution Park.
The vector stencils library "Office pictograms" contains 20 icons of office symbols, stationery, office supplies, writing implement, writing instruments. Use it to draw your business infographics. The example "Office pictograms - Vector stencils library" was created using the ConceptDraw PRO diagramming and vector drawing software extended with the Pictorial infographics solution from the area "What is infographics" in ConceptDraw Solution Park.
The vector stencils library "Office pictograms" contains 20 icons of office symbols, stationery, office supplies, writing implement, writing instruments. Use it to draw your business infographics. The example "Office pictograms - Vector stencils library" was created using the ConceptDraw PRO diagramming and vector drawing software extended with the Pictorial infographics solution from the area "What is infographics" in ConceptDraw Solution Park.
The vector stencils library "Office pictograms" contains 20 office pictograms.
Use it to draw your infographics.
The example "Design elements - Office pictograms" was created using the ConceptDraw PRO diagramming and vector drawing software extended with the Pictorial Infographic solution from the area "What is infographics" in ConceptDraw Solution Park.
Use it to draw your infographics.
The example "Design elements - Office pictograms" was created using the ConceptDraw PRO diagramming and vector drawing software extended with the Pictorial Infographic solution from the area "What is infographics" in ConceptDraw Solution Park.
Design Pictorial Infographics. Design Infographics
In the course of recent decades data visualization went through significant development and has become an indispensable tool of journalism, business intelligence and science. The way visual information may be conveyed is not limited simply to static or dynamic representation, it can also be interactive. Infographics can be conditionally divided into several general levels. Primarily, this is level of visualization of information, its interpretation and association on any ground. Second level can be defined as a visualization of knowledge, depiction of thoughts and ideas in the form of images or diagrams. Finally, the level of data visualization, which processes data arrays in charts, enabling the information to be more clearly perceived. You can also identify the main approaches to the creation of infographics: exploratory and narrative. Exploratory method insists on minimalist design in favor of data precision without unnecessary details and is common for scientific researches and anaInfographic Software
ConceptDraw PRO extended with Pictorial Infographics Solution from the “What are Infographics” Area is a powerful Infographic Software. Make sure in it right now!Infographic Maker
Infographic is a visual way of representing various information, data, knowledge in statistics, geography, journalism, education, and much more areas. ConceptDraw PRO supplied with Pictorial Infographics Solution from the “What are Infographics” Area, provides a set of powerful pictorial infographics tools. Thanks to them it is the best Infographic Maker.
 Cafe and Restaurant Floor Plans
Restaurants and cafes are popular places for recreation, relaxation, and are the scene for many impressions and memories, so their construction and design requires special attention. Restaurants must to be projected and constructed to be comfortable and e
 Fault Tree Analysis Diagrams
This solution extends ConceptDraw PRO v9.5 or later with templates, fault tree analysis example, samples and a library of vector design elements for drawing FTA diagrams (or negative analytical trees), cause and effect diagrams and fault tree diagrams.
 Fishbone Diagrams
The Fishbone Diagrams solution extends ConceptDraw PRO v10 software with the ability to easily draw the Fishbone Diagrams (Ishikawa Diagrams) to clearly see the cause and effect analysis and also problem solving. The vector graphic diagrams produced using this solution can be used in whitepapers, presentations, datasheets, posters, and published technical material.
 Cross-Functional Flowcharts
Cross-functional flowcharts are powerful and useful tool for visualizing and analyzing complex business processes which requires involvement of multiple people, teams or even departments. They let clearly represent a sequence of the process steps, the order of operations, relationships between processes and responsible functional units (such as departments or positions).
 Food Court
Use the Food Court solution to create food art. Pictures of food can be designed using libraries of food images, fruit art and pictures of vegetables.
 Entity-Relationship Diagram (ERD)
Entity-Relationship Diagram (ERD) solution extends ConceptDraw PRO software with templates, samples and libraries of vector stencils from drawing the ER-diagrams by Chen's and crow’s foot notations.
 Value Stream Mapping
Value stream mapping solution extends ConceptDraw PRO software with templates, samples and vector stencils for drawing the Value Stream Maps (VSM) in lean manufacturing practice.
The vector stencils library "Transport map" contains 96 pictograms for drawing transport maps.
Use it in your spatial infographics for visual representation of transport schemes and plans as metro maps in the ConceptDraw PRO diagramming and vector drawing software extended with the Spatial Infographics solution from the area "What is Infographics" of ConceptDraw Solution Park.
Use it in your spatial infographics for visual representation of transport schemes and plans as metro maps in the ConceptDraw PRO diagramming and vector drawing software extended with the Spatial Infographics solution from the area "What is Infographics" of ConceptDraw Solution Park.
- Office pictograms - Vector stencils library | Office pictograms - Vector ...
- Office pictograms - Vector stencils library | Picto Coffee
- Office pictograms - Vector stencils library | Office pictograms - Vector ...
- Office pictograms - Vector stencils library | Office pictograms - Vector ...
- Office pictograms - Vector stencils library | Office pictograms - Vector ...
- Office pictograms - Vector stencils library | Office pictograms - Vector ...
- Office pictograms - Vector stencils library
- Office pictograms - Vector stencils library | Appliances - Vector ...
- Coffee Cup Stencil Free Download
- Office pictograms - Vector stencils library | Cloud clipart - Vector ...
- Office pictograms - Vector stencils library | Appliances - Vector ...
- Office - Vector stencils library | Office pictograms - Vector stencils ...
- Export from ConceptDraw PRO Document to a Graphic File | Office ...
- Office pictograms - Vector stencils library | Metropolitan area ...
- Office pictograms - Vector stencils library | Design elements - Office ...
- Office pictograms - Vector stencils library | Office equipment - Vector ...
- Office pictograms - Vector stencils library | Sales workflow - Vector ...
- Office pictograms - Vector stencils library | Office Piktogram
- Office pictograms - Vector stencils library | Office Floor Plans ...
- Coffee Icon Png
