ER Diagram Tool
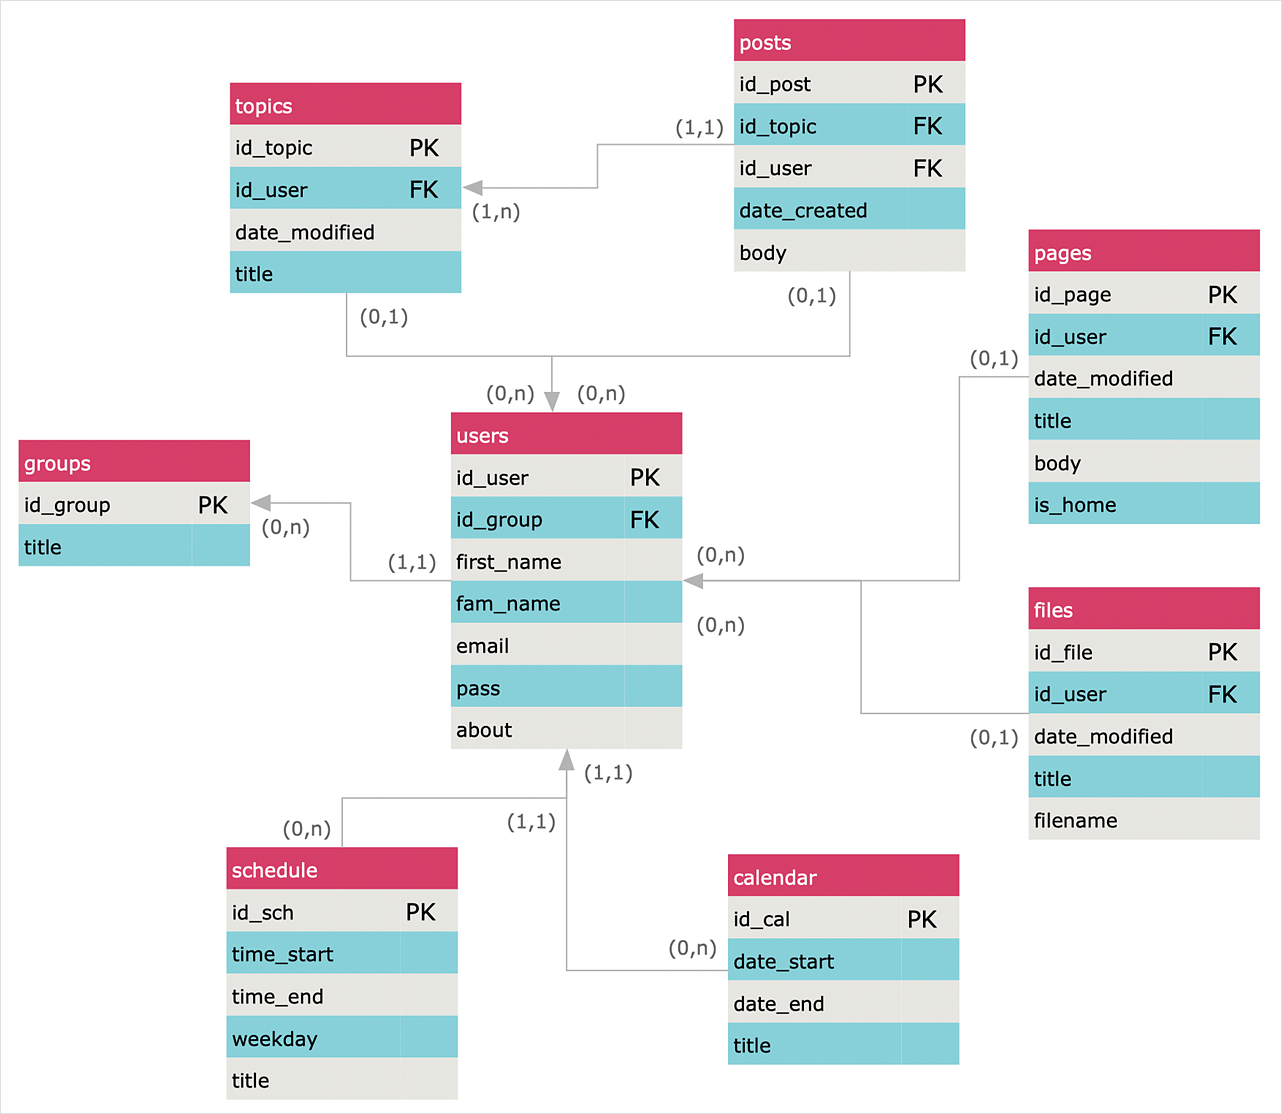
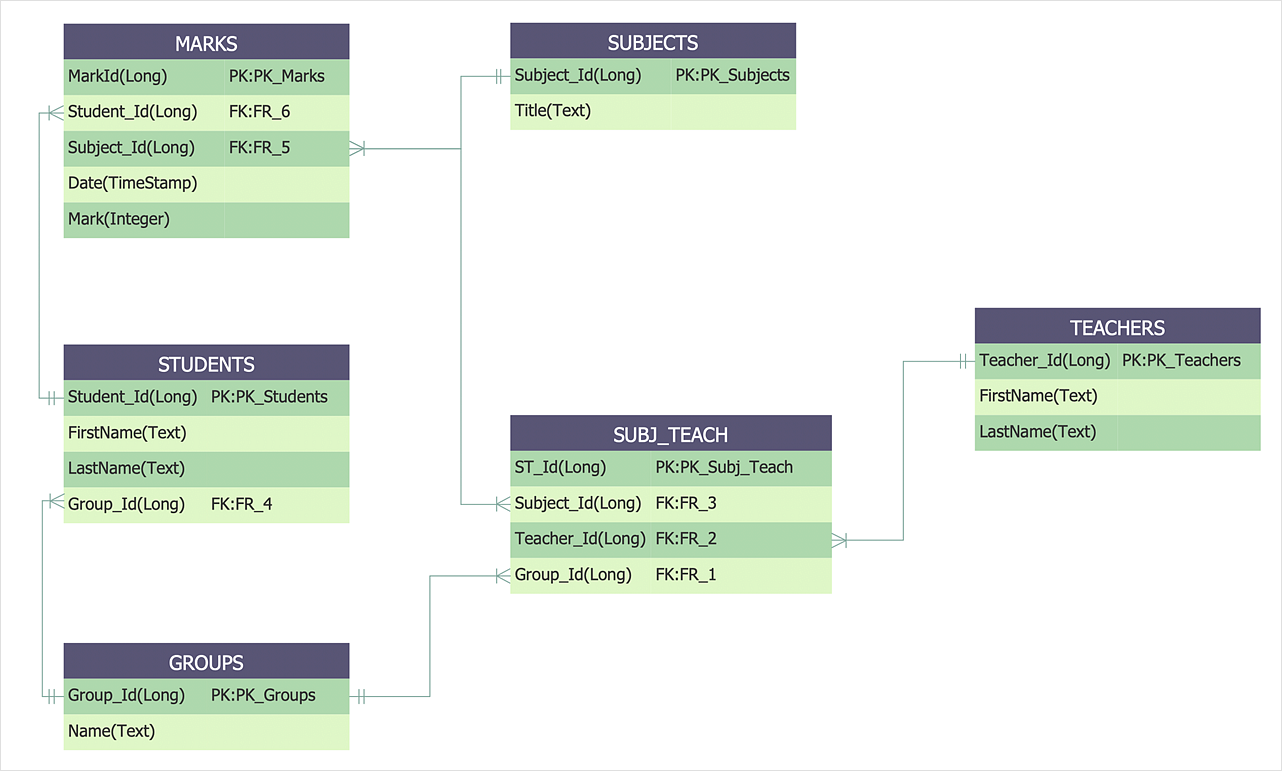
Creating of Entity-Relationship Diagrams (ERDs) is a complex process that requires convenient, automated tools. ConceptDraw DIAGRAM diagramming and vector drawing software offers a powerful ER Diagram Tool - the Entity-Relationship Diagram (ERD) Solution from the Software Development Area.
 ConceptDraw Solution Park
ConceptDraw Solution Park collects graphic extensions, examples and learning materials
HelpDesk
How to Create an Entity-Relationship Diagram
ERD (entity relationship diagram) is used to show the logical structure of databases. It represents the interrelationships between components of a database (entities). Entity relationship diagrams are widely used in software engineering. Using ERD software engineers can control every aspect of database development. ER diagram can be used as the guide for testing and communicating before the release of a software product. ERD displays data as entities that are connected with connections that show the relationships between entities. There are some ERD notations used by databases developers for representing the relationships between the data objects. ConceptDraw DIAGRAM and its ERD solution allow you to build ERD diagram of any notation.HelpDesk
How to Create an Entity-Relationship Diagram Using ERD Solution
An entity-relationship diagram (ERD)is used in a database modeling process. ERD diagram shows a graphical representation of objects or concepts within an information system and their relationships. The ability to describe a database using the Entity-Relationship model is delivered by the ConceptDraw ERD solution.
 ConceptDraw Solution Park
ConceptDraw Solution Park collects graphic extensions, examples and learning materials
Software and Database Design with ConceptDraw DIAGRAM
Unified Modeling Language (abbr. UML) is a modeling language used by software developers and software engineers for developing diagrams, expressive modeling, visualization, construction, specification, and documentation an information about software-intensive systems. There are used many types of UML diagrams, joined in main groups, each of them has its own functional abilities and applications: Behaviour diagrams illustrate the functionality of software systems, Structuring diagrams depict a structure of objects at the systems, Interaction diagrams show the flow of control and data among the things in a modeling system. UML has a lot of practical applications in varied areas, among them software development, hardware design, banking and financial services, telecommunication, science, research, enterprise information system, distributed Web-based services, user interfaces for web applications, medical electronics, patient healthcare systems, etc. ConceptDraw DIAGRAM extended with Rapid UML solution is a perfect tool for UML diagramming.Software Diagram Examples and Templates
ConceptDraw Pro is a powerful tool for business and technical diagramming. Software Development area of ConceptDraw Solution Park provides 5 solutions: Data Flow Diagrams, Entity-Relationship Diagram (ERD), Graphic User Interface, IDEFO Diagrams, Rapid UML.Data modeling with ConceptDraw DIAGRAM
Data modelling will help you to study and analyze business processes in your organization for optimization and increase of effectiveness and production.Databases Access Objects Model with ConceptDraw DIAGRAM
ConceptDraw Basic gives the opportunity of interaction with any ODBC-compatible databases. For this the Database Access Objects Model is provided. All calls to the database are made by certain methods of objects of this model.ATM Solutions
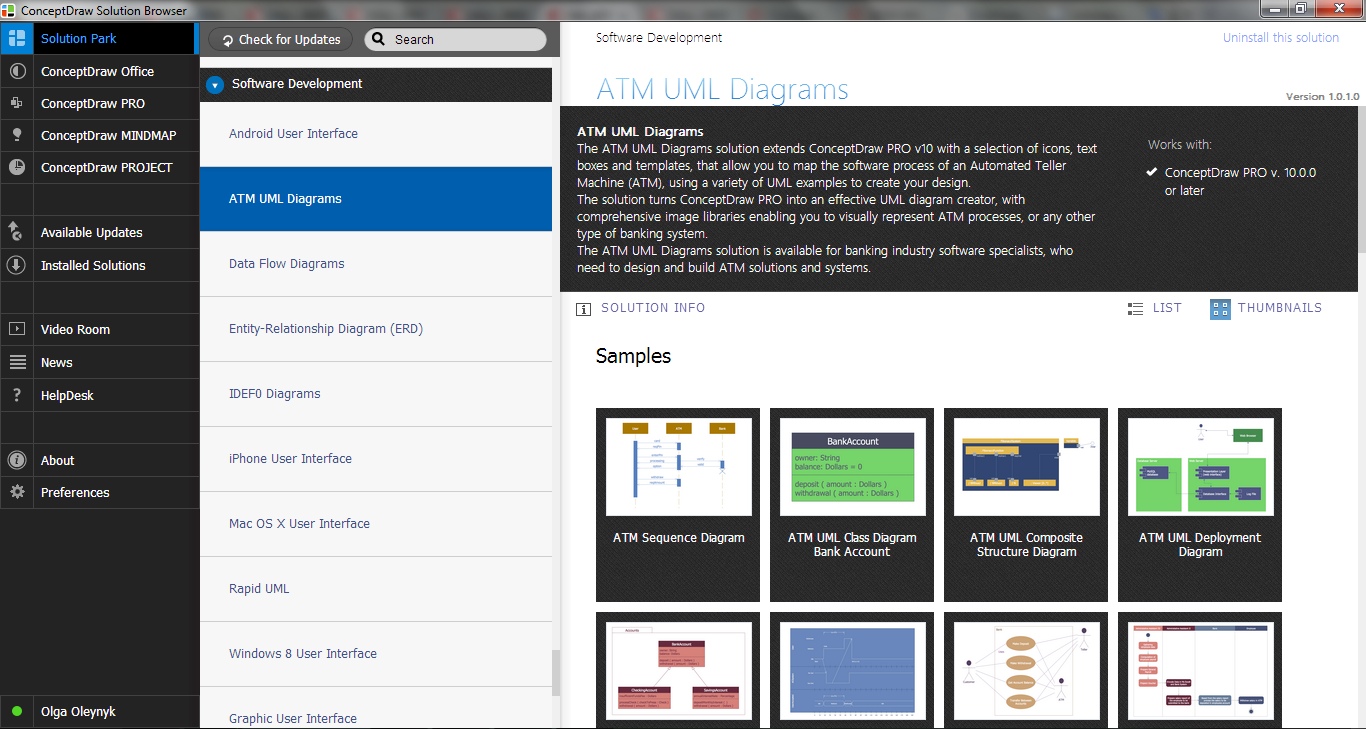
In the modern world the ATM Solutions are necessity for various software specialists, designers and developers in banking industry. ConceptDraw DIAGRAM diagramming and vector drawing software offers the unique ATM UML Diagrams Solution from the Software Development Area of ConceptDraw Solution Park.
 Fishbone Diagram
Fishbone Diagrams solution extends ConceptDraw DIAGRAM software with templates, samples and library of vector stencils for drawing the Ishikawa diagrams for cause and effect analysis.
Data Flow Diagram Examples
Data flow diagrams (DFDs) are effective to reveal relationships among the various components in a program or system. This type of diagrams is an important and useful technique for modeling an information system, its process aspects, for showing a system as a single high-level process. DFD lets illustrate the flow of data, how the input data are transformed to output results across the sequence of functional transformations. DFD consists of four major components: entities, processes, data stores, data flows. When you need to draw a Data Flow Diagram the ConceptDraw DIAGRAM diagramming and vector drawing software extended with Data Flow Diagrams solution will be helpful for you. Providing numerous collection of Data Flow Diagram examples, samples, templates and ready-to-use vector DFD symbols, Data Flow Diagrams solution ensures you with all needed tools for easy designing DFDs according to Gane-Sarson or Yourdon-Coad notation on your choice. Any from offered predesigned DFD examples can become a perfect base for your own diagram.Systems Engineering
Systems engineering is an interdisciplinary field of engineering that focuses on how to design and manage complex engineering systems over their life cycles. ConceptDraw DIAGRAM supplied with SysML Solution from the Software Development Area of ConceptDraw Solution Park is a powerful and effective systems engineering software.- Entity-Relationship Diagram ( ERD )
- Data Flow Diagram Symbols. DFD Library | Entity Relationship ...
- Entity-Relationship Diagram ( ERD ) with ConceptDraw PRO | IDEF0 ...
- Entity-Relationship Diagram ( ERD ) | ER Diagram Tool | Entity ...
- Entity-Relationship Diagram ( ERD ) with ConceptDraw PRO | UML ...
- Event-driven Process Chain Diagrams EPC | Fishbone Diagram ...
- Fishbone Diagram | Entity-Relationship Diagram ( ERD ) | Entity ...
- Entity-Relationship Diagram ( ERD ) | State Machine Diagram | SWOT ...
- Entity Relationship Diagram Symbols and Meaning ERD Symbols ...
- Seating Plans | Entity-Relationship Diagram ( ERD ) | ConceptDraw ...
- Entity Relationship Diagram Examples
- Entity-Relationship Diagram ( ERD )
- Anyone Have an ERD Symbols Quick Reference? | AWS ...
- How to Build a Flowchart | Entity-Relationship Diagram ( ERD ) with ...
- Event-driven Process Chain Diagrams EPC | Entity Relationship ...
- Technical Drawing Software | Entity Relationship Diagram Software ...
- UML Class Diagram Example - Medical Shop | Entity-Relationship ...
- Process Flowchart | Entity Relationship Diagram Symbols and ...
- Basic Flowchart Symbols and Meaning | Entity Relationship ...


