Sales Process Flowchart Symbols
The most easier way of creating the visually engaging and informative Sales Process Flowchart is to create the new ConceptDraw document and to use the predesigned vector symbols offered in 6 libraries of the Sales Flowchart Solution. There are more than six types of sales process flow diagrams, ConceptDraw DIAGRAM software is flowchart maker which include six collections of extended flowchart symbols for effective diagramming. There are main collections of color coded flowchart symbols: Sales Department, Sales Steps, Sales Workflow, Sales Symbols and special set of Sales Arrows and Sales Flowchart.
 Sales Dashboard
Sales Dashboard solution extends ConceptDraw DIAGRAM software with templates, samples and library of vector stencils for drawing the visual dashboards of sale metrics and key performance indicators (KPI).
Process Mapping
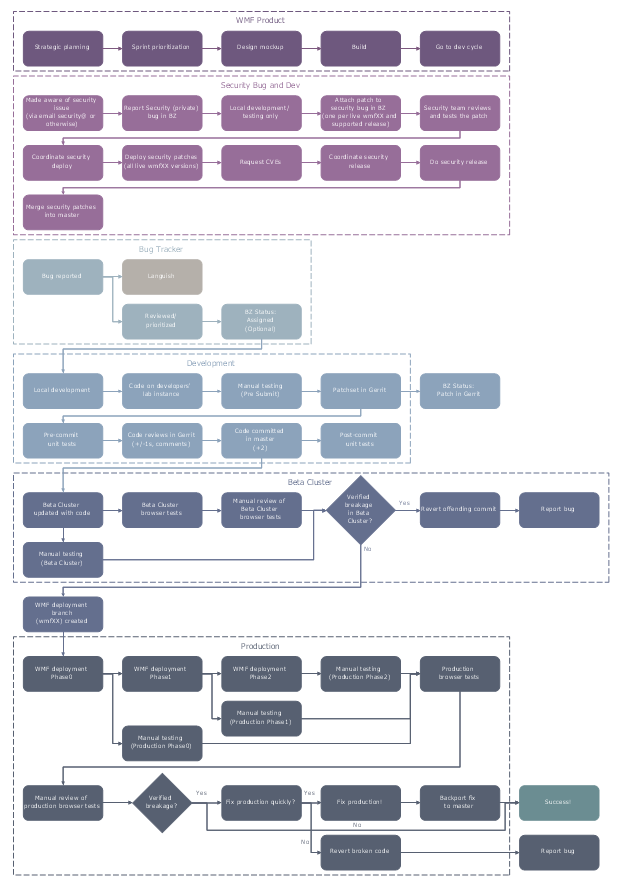
ConceptDraw DIAGRAM diagramming and vector drawing software offers the unique Business Process Mapping Solution from the Business Processes Area of ConceptDraw Solution Park. Powerful drawing tools of this solution make it effective Business Process Mapping software and help easy design professional looking business process diagrams and flowcharts.How to Connect Social Media DFD Flowchart with Action Maps
The Social Media Response solution creates interactive social media flow charts and action mind maps. The solution includes a video tutorial and a number of samples helping social media teams refine and organize their response process.Response to Complaint
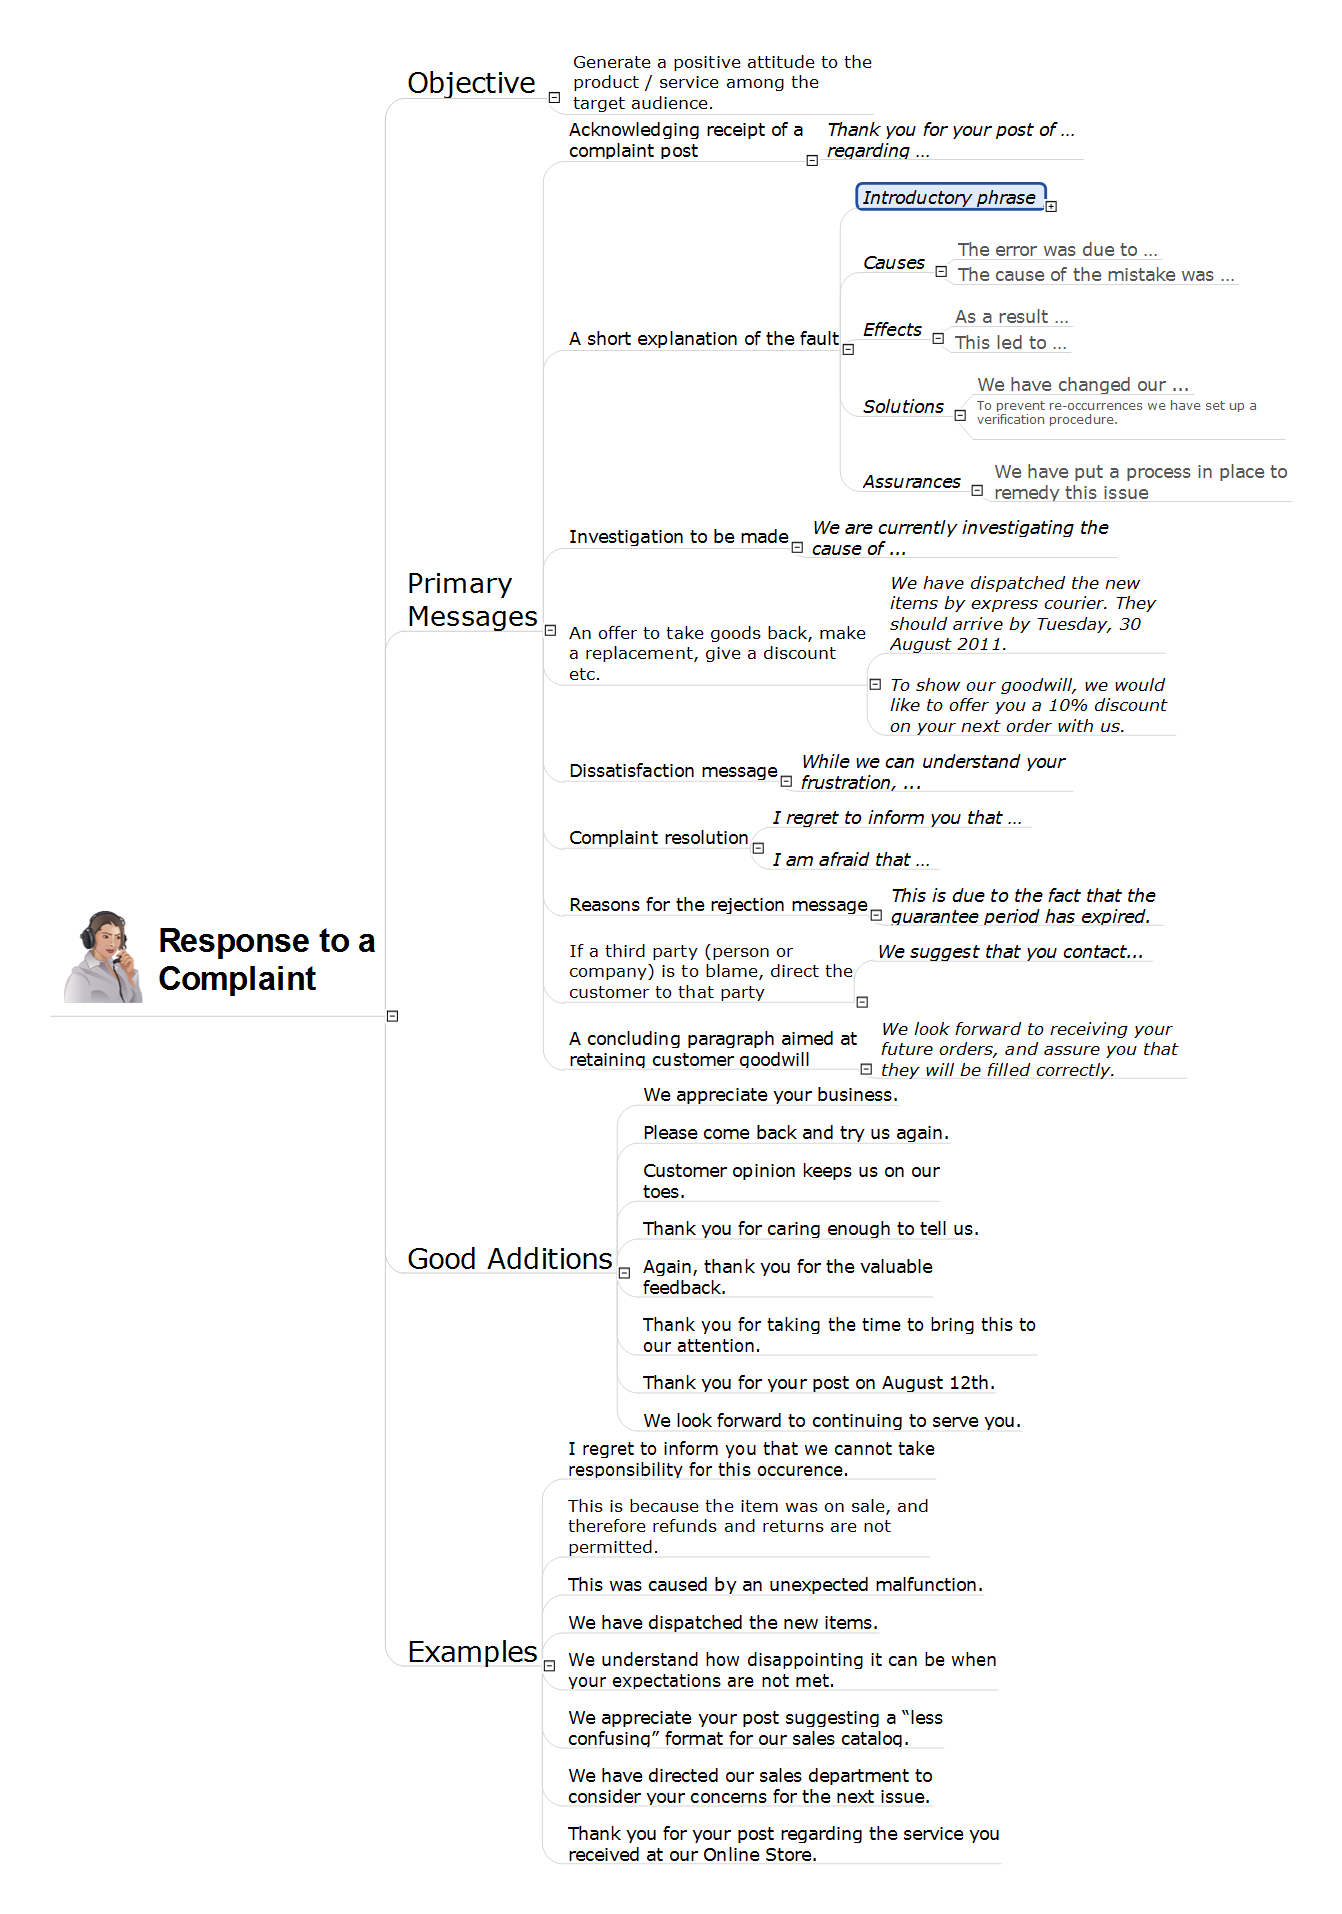
Every company that exists on the market, at least once was faced with a written complaint of its client. Typically, this is unexpectedness, but you need to be well prepared for this, because from what how you will respond to the complaint depends the success of your future cooperation with these clients and many others. Moreover, the dealing with complaints is a clear indication of how you are able to work with clients and how you appreciate them. The negative reviews can easy scare away new customers, so if any person appealed for you with a complaint, your task is as quickly as possible to resolve the situation, to show the client that you listen to his wishes, quickly react to them and correct your mistakes. The disregard of upset people is unacceptable and could lead to the sad consequences. And vice versa, the correct response to the claim helps to settle the dispute, to keep the situation under the control, to save time, to restore the reputation and to keep the client base. This action Mind Map designed in ConceptDraw MINDMAP effectively helps to quickly respond to customer complaints and contains a variety of short or long response messages.Percentage Spider Chart
ConceptDraw PRO creates drawings, diagrams and charts with great visual appeal in Mac OS X. This sample shows the Spider Chart that represents the buyer perceptions of the leather footwear industries in Brazil, India and Italy.Sales Process Flowchart. Flowchart Examples
Sales Process Flowchart is an invaluable tool for business. It gives you opportunity to visualise and better understand the sales process, reveal and also visually highlight issues or bottlenecks, and predict the number of sales. The Flowchart is ideal method to represent in details all steps of the process, tasks and decisions needed to obtain maximum effectiveness and success. The steps are graphically represented by boxes linked with arrows indicating direction of the workflow, decision is shown by diamond. The sales process is closely linked to the company's success and usually includes the following main steps: Product knowledge, Prospecting, Planning the sale (Pre-approach), Approach, Need assessment, Presentation, Meeting objections, Gaining commitment, Follow-up. Create fast and easy your own Flowcharts of sales business processes using the ConceptDraw DIAGRAM ector graphic software extended with Cross-Functional Flowcharts solution from Business Processes area and also Sales Flowcharts solution from Marketing area of ConceptDraw Solution Park.How to Prepare Learning Presentations for Training
Interactive tool helps you find the appropriate response to social media mentions quickly.Sales Teams are Inherently Competitive
Sales teams are inherently competitive, so you don't need to invent extra ways to stimulate the competition. At the same time, you can provide the team with a sales dashboard shows company, team and personal KPI to make the competition clear.How to Make Audio and Video Connections
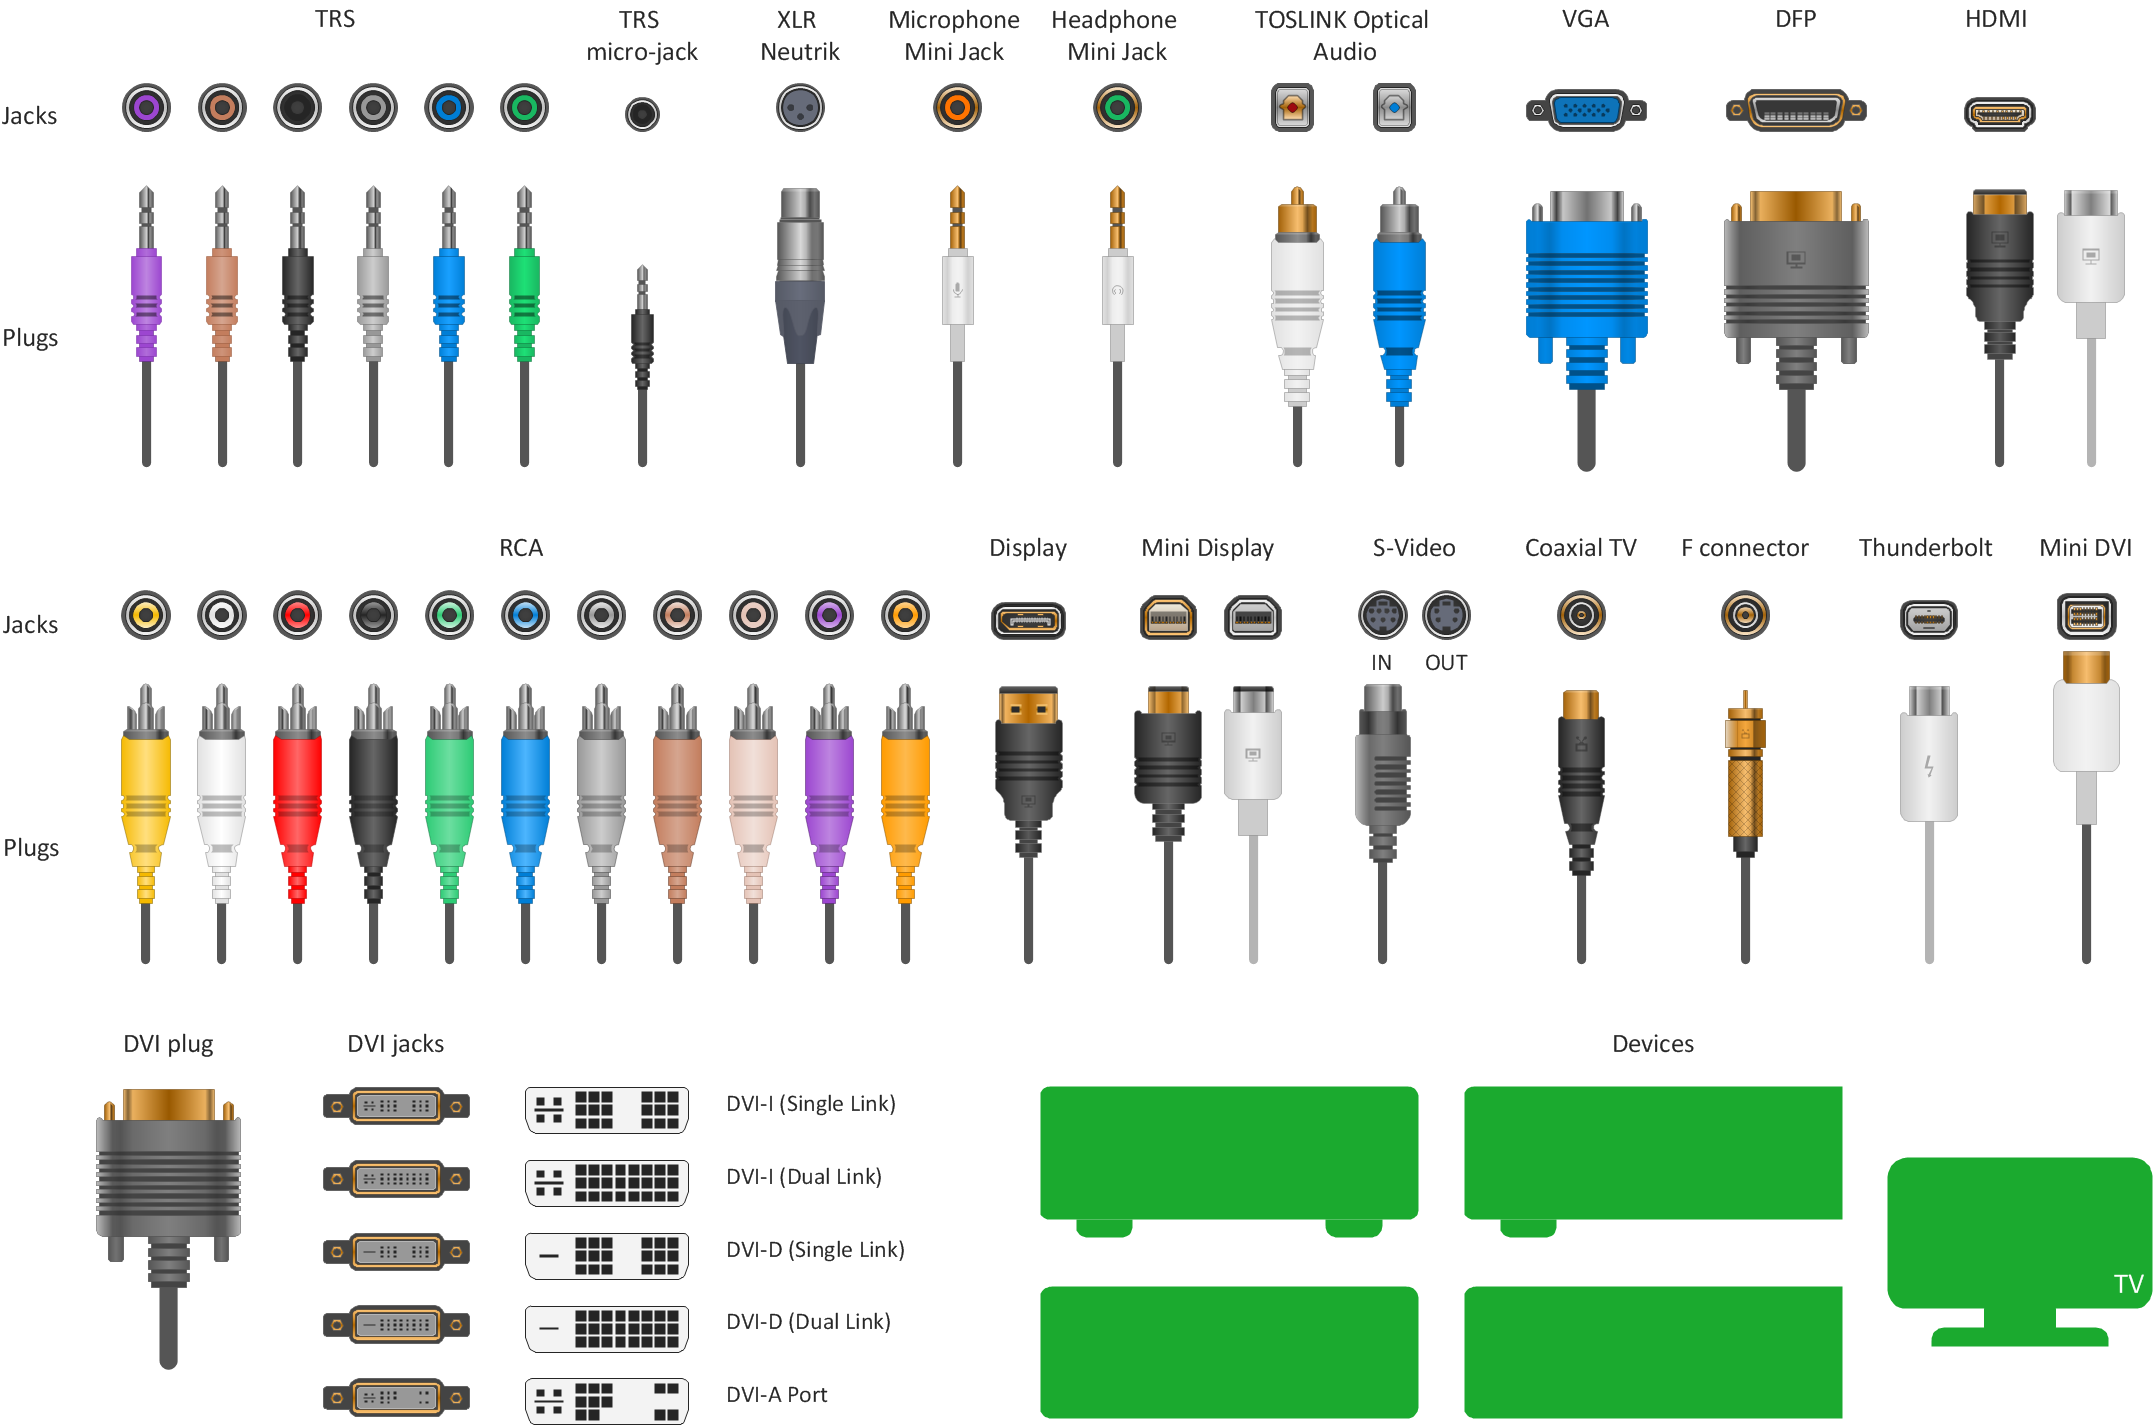
Use the ConceptDraw DIAGRAM software that has vector clipart of numerous cable connectors, examples, and templates for drawing different types of audio and video connection diagrams. Paste icon of the receiver or another device to page and layout sockets and plugs. Further connect plugs with each other, and now you have well-designed connection diagram.- Basic Flowchart Symbols and Meaning | Audit Flowchart Symbols ...
- Flow Chart Color Coding
- Us Color Coded Map
- Sales Performance | Sales Process Map | Sales Growth. Bar Graphs ...
- Continent Maps | East And Southeast Asia Color Coded Map
- Flowchart Color
- Sales Distribution Flow Chart
- Create Response Charts | Sales Erd Script
- Sales Process Flowchart. Flowchart Examples | Sales Process Map ...
- Competitor Analysis | Sales Process Flowchart Symbols | Rack ...


