Sales Process Flowchart Symbols
The most easier way of creating the visually engaging and informative Sales Process Flowchart is to create the new ConceptDraw document and to use the predesigned vector symbols offered in 6 libraries of the Sales Flowchart Solution. There are more than six types of sales process flow diagrams, ConceptDraw DIAGRAM software is flowchart maker which include six collections of extended flowchart symbols for effective diagramming. There are main collections of color coded flowchart symbols: Sales Department, Sales Steps, Sales Workflow, Sales Symbols and special set of Sales Arrows and Sales Flowchart.Flowchart design. Flowchart symbols, shapes, stencils and icons
A flowchart is a type of diagram which represents an algorithm, process or workflow, displays the steps as boxes of various kinds and depicts their order by connecting them with arrows. Any business graphic document will be more colorful and understandable if will use professional-looking and visual diagrams and flowcharts. Flowchart design gives versatile presenting and explaining of the process. ConceptDraw DIAGRAM flowchart software enhanced with Flowcharts solution helps effectively make Flowchart Design. Use of predesigned flowchart symbols and bright color palette offers a fresh view and favorably distinguishes the flowcharts designed in ConceptDraw DIAGRAM from the black and white flowcharts on a paper. Preferably to use no more than three or four colors and apply identical for the same shape types. The best flowchart design can be achieved by starting with Flowchart template, or any of suitable ready examples or samples offered in ConceptDraw STORE, open one of them and enter the proper text into each Flowchart shape. Each symbol of the flowchart has a definition that can't be changed. This means that all flowcharts shapes can be grouped in according to their meaning. Users with ConceptDraw DIAGRAM flowchart software can style groups of symbols with close definitions by color sets chosen from complementary palette. Almost all workflows can be depicted as a flowchart. Colored diagrams are more light for perception of the certain information, this is part of flowchart design. Bright colors need to be used in the key points of Decision symbols, to focus attention on their importance for whole process flow.
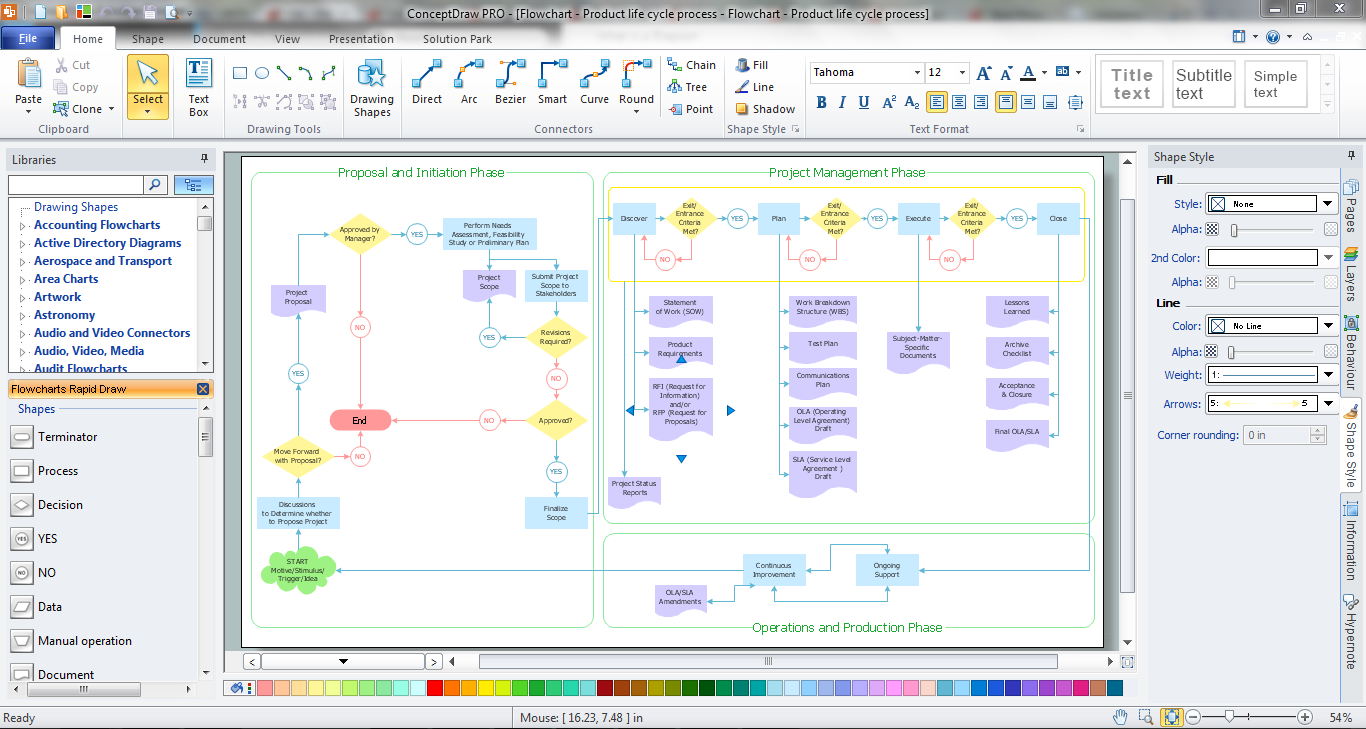
How To Create a Flow Chart in ConceptDraw
ConceptDraw DIAGRAM is a flowchart creating software. This software includes over 20 vector stencils in libraries. These objects allow you to create well-designed flowcharts. Put an initial object from library to a page and use RapidDraw technology clicking on direction arrows to add new objects to the flowchart. This way you can make flowchart quickly.Audit Flowchart Symbols
The audit is a complex process consisting of defined quantity of steps, which have as a final goal the ensuring of success of a certain business project. It includes the independent examination of data, statements and financial performances of an enterprise for a stated purpose. It is convenient to construct the Audit Flowcharts or Audit Diagrams for visual representation and structuring the audit processes. ConceptDraw DIAGRAM diagramming software enhanced with Audit Flowcharts solution from the Finance and Accounting area of ConceptDraw Solution Park effectively helps to draw the Audit Diagrams for accounting, finance and money management, the Audit Flowcharts for fiscal information tracking, financial inventories and documenting Six Sigma, the decision making Flow Charts, etc. This solution provides the powerful drawing tools, numerous templates and samples, and large quantity of vector audit flowchart symbols that greatly facilitate the process of representation the audit steps and audit results, and designing efficient and visually appealing Audit Flowcharts.Software Flow Chart
Many professionals have to solve problems every day. Designing of the process algorithm contribute to understand where the problem is in the process. A Flowchart is a graphical tool that most usable for breaking down processes. Definition of flowchart - a diagram that shows step-by-step progression through a procedure or system especially using connecting lines and a set of conventional symbols. All the icons, symbols and connectors needed for creating standardized notation flowcharts are contained within Software Flow Chart.How to Connect Social Media DFD Flowchart with Action Maps
The Social Media Response solution creates interactive social media flow charts and action mind maps. The solution includes a video tutorial and a number of samples helping social media teams refine and organize their response process.Sales Steps
Helps to create professionally looking and detailed Sales Flowcharts with all sales steps visually represented on them. Use the Sales Flowcharts Solution for ConceptDraw DIAGRAM software to create your own Sales Flowcharts of any complexity quickly, easily and effectively to use them successfully in your work activity. ConceptDraw DIAGRAM diagramming and vector drawing software supplied with unique Sales Flowcharts solution from the Marketing area of ConceptDraw Solution Park allows fast and easy visualize all sales steps of the sales process on a sales process Map or sales process flowchart, and then realize them easily.Flow Chart Creator
It is impossible to imagine the managing and analyzing of business and technical processes without flowcharts. They are the best way to visually represent the structural data, algorithms, the steps of the process, they allow to illustrate the process flow direction and solution to a given problem. ConceptDraw DIAGRAM diagramming and vector drawing software extended with flowchart maker and Flowcharts Solution from the "Diagrams" Area is a powerful Flow Chart Creator.
Flowcharts
The Flowcharts solution for ConceptDraw DIAGRAM is a comprehensive set of examples and samples in several varied color themes for professionals that need to represent graphically a process. Solution value is added by the basic flow chart template and shapes' libraries of flowchart notation. ConceptDraw DIAGRAM flow chart creator lets one depict the processes of any complexity and length, as well as design the Flowchart either vertically or horizontally.
Flow Chart Symbols
ConceptDraw DIAGRAM software extended with Flowcharts Solution from the "Diagrams" Area is a powerful software that will help you design the flowcharts for any business and technical processes, and software algorithms thanks to the predesigned flow chart symbols. Flowcharts solution offers 2 libraries with large collection of vector flow chart symbols: Flowchart Library, Flowcharts Rapid Draw Library that you can use to create your flowcharts quick and easy. Flowchart Solution is number of diagraming stencils including special set of flow chart symbols such as: terminator, process, decision which indicates a decision points between two or more paths in a flowchart, symbol of delay. Major symbols includes symbol of data, document or multiple documents, subroutine, preparation for processing of documents. Also includes symbols: display, manual input, manual loop, loop limit, stored data,connectors and suming junctions, sort and merge operations, symbols of database and internal stor- Flow Chart Color Coding
- Color Palette Mapping Function Flowchart
- Flowchart Standard Colors
- Flow Chart Color Scheme
- Basic Flowchart Symbols and Meaning | Cross Functional Flowchart ...
- Rainbow Colors Flow Chart An Alogarithm
- Flow Chart Colours
- Audit Flowchart Symbols | Basic Flowchart Symbols and Meaning ...
- Flowchart Components | Copying Service Process Flowchart ...
- Flow Chart Symbols | Flowchart design. Flowchart symbols, shapes ...