Venn Diagram Examples for Problem Solving. Venn Diagram as a Truth Table
Venn diagrams are illustrations used in the branch of mathematics known as set theory. They show the mathematical or logical relationship between different groups of things (sets). A Venn diagram shows all the possible logical relations between the sets.UML Diagram
The accepted open standard that is used in software engineering and system design, when modeling object-oriented systems and business processes is known as Unified Modeling Language (UML). UML was created for definition, visualization, design and documentation software systems. It isn't a programming language, but on the base of UML model can be generated code. UML uses generic set of graphic notations for creation an abstract model of the system called UML-model. The UML notation lets visually represent requirements, subsystems, structural and behavioral patterns, logical and physical elements, etc. UML defines 13 types of diagrams: Class (Package), Use Case, Sequence, Object, Collaboration, Component, Timing, Interaction Overview, State Machine, Composite Structure, Activity, and Deployment. All these types of UML Diagrams can be fast and easy created with powerful ConceptDraw DIAGRAM software extended with special Rapid UML solution from Software Development area of ConceptDraw Solution Park.Use this template to design your four set Venn diagrams.
In maths logic Venn diagram is "a diagram in which mathematical sets or terms of a categorial statement are represented by overlapping circles within a boundary representing the universal set, so that all possible combinations of the relevant properties are represented by the various distinct areas in the diagram". [thefreedictionary.com/ Venn+diagram]
The template "4-set Venn diagram" for the ConceptDraw PRO diagramming and vector drawing software is included in the Venn Diagrams solution from the area "What is a Diagram" of ConceptDraw Solution Park.
Table Seating Chart Template
The arrangement of tables and seating charts near them have great value in many premises and situations. It is often very convenient to draw a plan before the furniture arrangement. ConceptDraw DIAGRAM software offers the Seating Plans solution from the Building Plans area for fast and easy drawing the table seating chart template and samples.Technical Drawing Software
Technical drawing or draft is a form of specialized graphic communication, exchange of ideas in industry and engineering. It is a visual representation of object with indication of dimensions and used material, constructed with maintaining the proportions between its parts. Technical drawings are constructed by architects, technologists, engineers, designers, drafters, and other technical professionals according to defined rules, specifications, internationally accepted standards and standardized notations allowing to make unambiguous, clear and understandable technical drawings. ConceptDraw DIAGRAM extended with Electrical Engineering solution, Mechanical Engineering solution, Chemical and Process Engineering solution from Industrial Engineering Area of ConceptDraw Solution Park is ideal technical drawing software. Its powerful drawing tools, predesigned vector objects, templates, samples are helpful for creation all kinds of Technical Drawings and Technical Diagrams, Electrical and Mechanical Schematics, Circuit and Wiring Diagrams, Structural Drawings, and many other.HelpDesk
How to Resize Objects
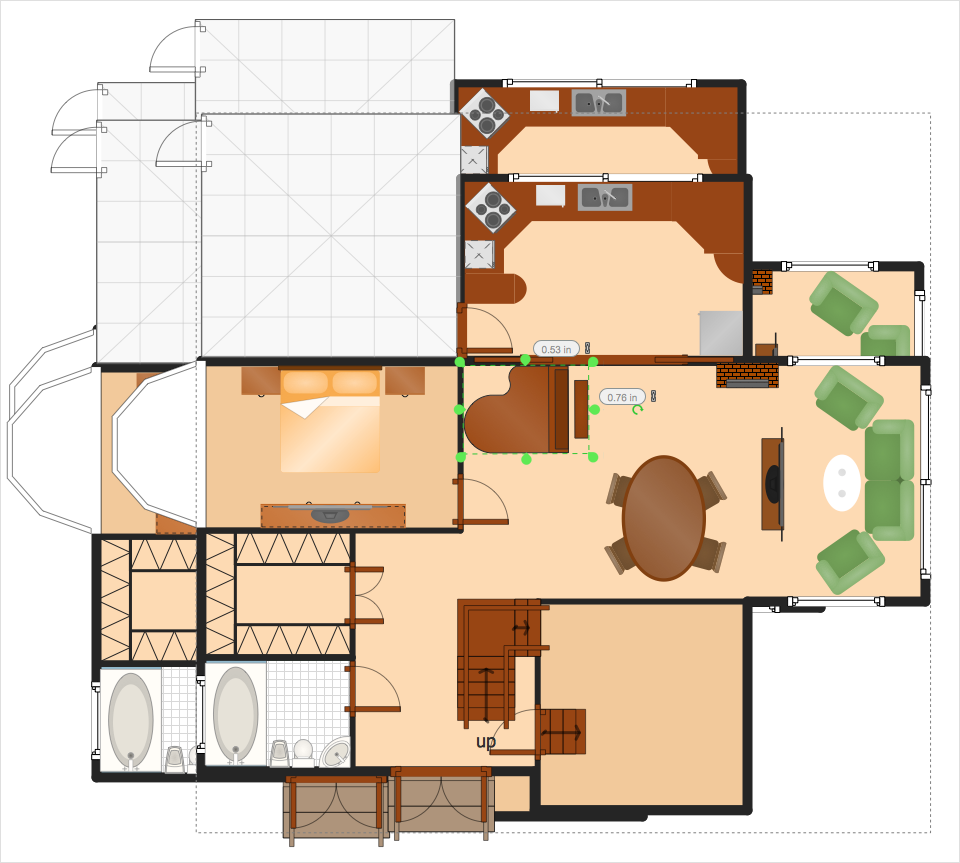
When creating diagram using ConceptDraw DIAGRAM , you can select, move, resize and rotate objects. After selecting an object (or objects) in a document, you can change it position, resize it or move an object to the desired position. The sizes of objects in ConceptDraw DIAGRAM can be changed by simple dragging, or you can set a particular size of any object. Using ConceptDraw PRO, you can re-size an object on the page using the absolute measurements instead of a mouse. You can make quick work of designing complex drawing using a combination of different-sized items.Basic Diagramming
Try ConceptDraw program, the perfect drawing tool for creating all kinds of great-looking drawings, charts, graphs, and illustrations.
The Best Drawing Program for Mac
ConceptDraw DIAGRAM is the professional business graphic software for drawing diagrams and charts with great visual appeal on Mac OS X.HelpDesk
How to Make a Garden Design
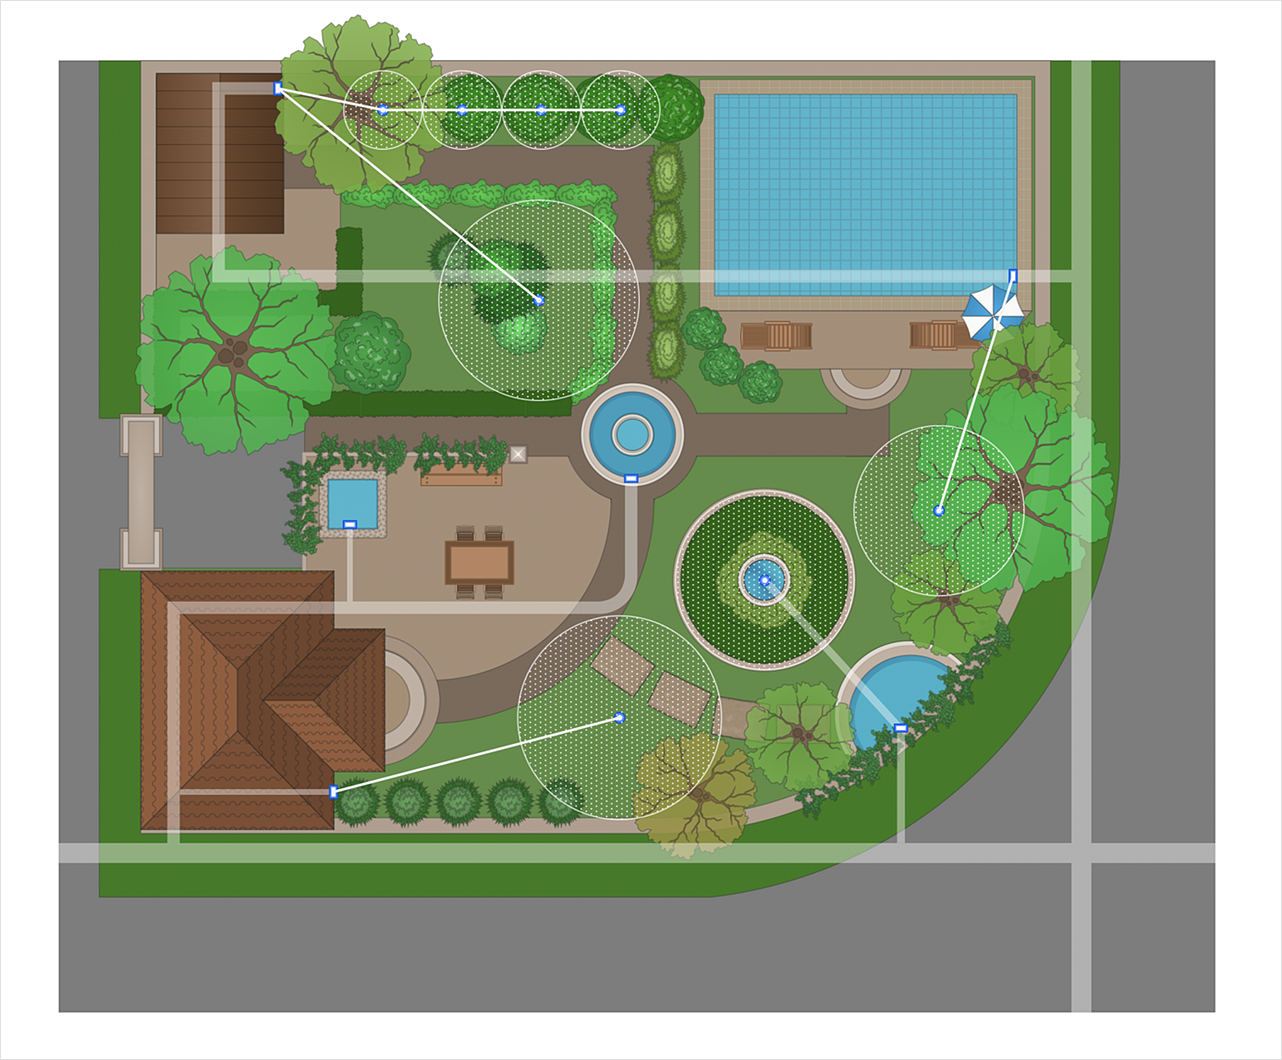
Landscape and garden design involves a varied range of activities that can be managed using ConceptDraw Landscape and Garden solution. Landscape and garden design can embrace landscape management, engineering, detailing, urbanism, assessment, and planning. The Landscape and Garden solution delivers the ability to sculpt your perfect garden design with a range of libraries and templates. These libraries include graphic design elements such as bushes and trees, flower and grass, ponds and fountains, garden furniture and accessories, and paths, plots, and patios. Using them in combination with the handy templates included with the solution is the quickest and simplest method of starting to plan your garden design.How To Make a Bubble Chart
Bubble diagrams solution extends ConceptDraw DIAGRAM software with templates, Using ConceptDraw Connectors, you can make a bubble chart in moments. Using ConceptDraw you will be able to make a bubble chart from the ready ConceptDraw library objects or make your own objects. The created diagram can represent ideas organization, in brainstorming processes, by teachers for explaining difficult ideas or for presentations.Best Vector Drawing Application for Mac OS X
ConceptDraw DIAGRAM creates drawings, diagrams and charts with great visual appeal in Mac OS X.ConceptDraw DIAGRAM The best Business Drawing Software
ConceptDraw DIAGRAM is new software for business and technical drawing. Powerful business drawing tools, extensive libraries with pre-drawn shapes, free samples of business drawings, technical drawings and flowcharts, support of many graphic formats enable users to visually develop their business drawings charts and diagrams in any combination of drawings, diagrams and flow charts.- Venn Diagrams | Venn Diagram | Venn Diagram Examples for ...
- 4-Set Venn diagram - Template | Venn diagrams - Vector stencils ...
- Venn diagram - Relationship marketing | Relationship marketing ...
- 3 Circle Venn Diagram Template
- 4-Set Venn diagram - Template | Venn diagrams - Vector stencils ...
- 5-Set Venn diagram - Template
- Interactive Venn Diagram | 5-Set Venn diagram - Template | Venn ...
- 5-Set Venn diagram - Template
- What Is a Circle Spoke Diagram | Cylinder Venn Diagram | Venn ...
- Venn Diagram Maker | Flow Chart Creator | 4-Set Venn diagram ...
- 5-Set Venn diagram - Template
- Venn Diagram Templates
- Venn Diagram | Venn Diagram Template | Circle Spoke Diagram ...
- 4-Set Venn diagram - Template | Venn diagrams - Vector stencils ...
- Venn Diagram Template for Word | Venn Diagrams | 5-Set Venn ...
- Sets And Venn Diagrams
- Venn Diagram For Four Sets
- Venn Diagrams | Venn Diagram Examples for Problem Solving ...
- Venn Diagrams | Venn Diagram Maker | Venn Diagram Template for ...
- Circles Venn Diagram | Venn Diagram Template | Venn Diagram | 4 ...


