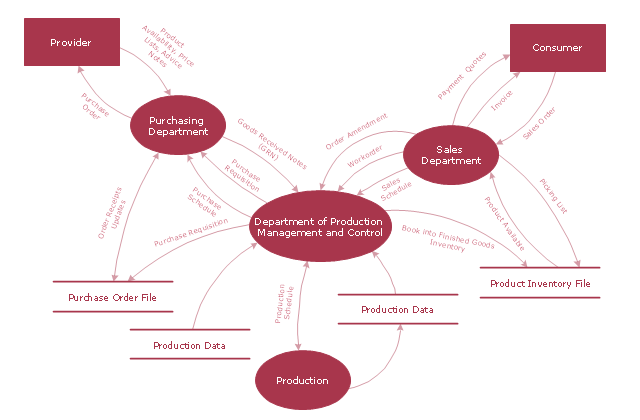
"A data flow diagram (DFD) is a graphical representation of the "flow" of data through an information system. It differs from the flowchart as it shows the data flow instead of the control flow of the program. A data flow diagram can also be used for the visualization of data processing (structured design). Data flow diagrams were invented by Larry Constantine, the original developer of structured design, based on Martin and Estrin's "data flow graph" model of computation.
It is common practice to draw a context-level Data flow diagram first which shows the interaction between the system and outside entities. The DFD is designed to show how a system is divided into smaller portions and to highlight the flow of data between those parts. This context-level Data flow diagram is then "exploded" to show more detail of the system being modeled" [Data model. Wikipedia]
The DFD (Yourdon and Coad notation) example "Model of small traditional production enterprise" was created using the ConceptDraw PRO diagramming and vector drawing software extended with the Data Flow Diagrams solution from the Software Development area of ConceptDraw Solution Park.
Data Flow Diagram (DFD)
A Data Flow Diagram (DFD) illustrates the flow of data through an information system, visualizes how the information is handled in terms of inputs and outputs, how the data enter to system and leave it. It is effective to use a Data Flow Diagram for creation the system's overview, to show the system's scope and boundaries. There are two different types of notations for DFDs: Yourdon-Coad and Gane-Sarson, which differ in visual representations for processes, data flow, data stores, external entities, etc. Thus, for example the processes are depicted as circles in Yourdon-Coad notation and as rounded squares in Gane-Sarson notation. Gane-Sarson notation is usually used for visualization information systems and Yourdon-Coad - for system analysis and design. The Data Flow Diagrams solution included to Software Development area of ConceptDraw Solution Park offers a lot of DFD templates, samples and examples, libraries of vector stencils for construction without efforts the DFDs according to both Gane-Sarson and Yourdon-Coad notations.Gane Sarson Diagram
The Gane-Sarson methodology uses the graphical techniques for building the logical models for the systems. It is helpful for analysts and designers to make common and clear picture of the system, to depict all its processes and how they transform the data. The Gane-Sarson methodology lets represent all this information in a way understandable for the users and other interested people, and gives the possibility to see instantly how the system's parts serve together to meet their needs. This methodology supposes the building of a system top-down. First you need create an overall system data flow, then determine the details of the data structures, the process logic and design the modular structures. ConceptDraw DIAGRAM diagramming and vector drawing software offers the Data Flow Diagrams solution with Gane-Sarson Notation library rich for the specific symbols of the Gane-Sarson notation. All they are vector and fully ready-to-use for drawing the Data Flow Diagrams, which will be then successfully used in presentations, websites, and various business documents.- DFD ( Yourdon and Coad ) template | Design Data Flow. DFD Library ...
- Yourdon and Coad Diagram | DFD ( Yourdon and Coad ) template ...
- Data flow diagram (DFD) template | Data Flow Diagram
- Example of DFD for Online Store (Data Flow Diagram). DFD ...
- Design elements - Data Flow Diagram (DFD) | Software and ...
- Data Flow Diagram Model | DFD - Model of small traditional ...
- Structured Systems Analysis and Design Method (SSADM) with ...
- Data flow Model Diagram
- Data Flow Diagram Model
- Data flow diagram (DFD) - Payment for goods using UPS code ...
- Target and Circular Diagrams | Design elements - Target and ...
- Flow chart Example. Warehouse Flowchart | Design elements ...
- Data Flow Diagram Process | DFD - Process of account receivable ...
- Accounting Flowcharts | Purchase Process Flow Chart. Accounting ...
- How to Create a Social Media DFD Flowchart | What is Interactive ...
- Design elements - Data Flow Diagram (DFD) | Software and ...
- ERD Symbols and Meanings | Entity Relationship Diagram Symbols ...
- Booch OOD Diagram | ORM Diagram | COM and OLE Diagram ...
- Data modeling with ConceptDraw PRO | Data Modeling Diagram ...
- Data Flow Diagram (DFD) | DFD Library System ... - Conceptdraw.com


