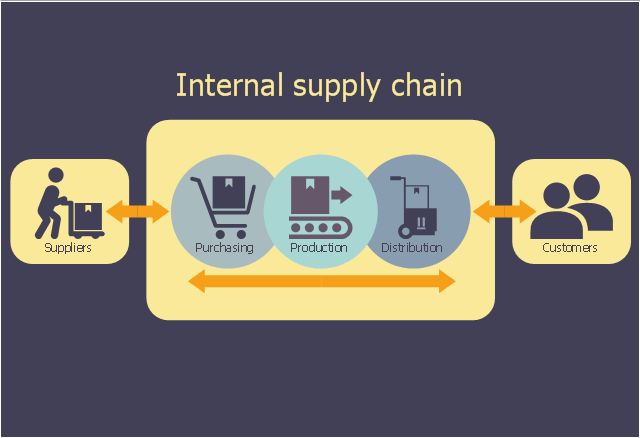
This logistic flow chart sample shows the company's supply chain. It was designed on the base of the Wikimedia Commons file: A company's supply chain (en).png. [commons.wikimedia.org/ wiki/ File:A_ company%27s_ supply_ chain_ (en).png]
This file is licensed under the Creative Commons Attribution-Share Alike 3.0 Unported license. [creativecommons.org/ licenses/ by-sa/ 3.0/ deed.en]
"A supply chain is a system of organizations, people, activities, information, and resources involved in moving a product or service from supplier to customer. Supply chain activities involve the transformation of natural resources, raw materials, and components into a finished product that is delivered to the end customer. In sophisticated supply chain systems, used products may re-enter the supply chain at any point where residual value is recyclable. Supply chains link value chains." [Supply chain. Wikipedia]
The logistic flowchart example "A company's supply chain" was created using ConceptDraw PRO diagramming and vector drawing software extended with the Logistics Flow Charts solution from the Business Processes area of ConceptDraw Solution Park.
 Pie Charts
Pie Charts are extensively used in statistics and business for explaining data and work results, in mass media for comparison (i.e. to visualize the percentage for the parts of one total), and in many other fields. The Pie Charts solution for ConceptDraw PRO v10 offers powerful drawing tools, varied templates, samples, and a library of vector stencils for simple construction and design of Pie Charts, Donut Chart, and Pie Graph Worksheets.
 Sales Flowcharts
The Sales Flowcharts solution lets you create and display sales process maps, sales process workflows, sales steps, the sales process, and anything else involving sales process management.
- Company Incentives Icon Png
- Vicious circle - Crystal diagram | Business - Vector stencils library ...
- Colorful Circle Backgrounds Png
- Circle Arrow Png
- Icon Computer Networking Circle Png
- Pyramid Diagram | Business - Vector stencils library | Design ...
- Development Operations Flat Png Images
- Home Icon Circle Png
- Company Progress Bar Png
- Time For Expansion Clip Art Png
- Research cycle - Circle diagram | Process Flowchart | Network ...
- Aroow Circle Png
- Time - Design Elements | Business People Clipart | Presentation ...
- 6 Circles Flow Chart Png
- Discipline Vector Png
- Research cycle - Circle diagram | Process Flowchart | Presentation ...
- Business feedback loop | Helpful in all stages of quality ...
- Research cycle - Circle diagram | Flowchart design. Flowchart ...
- Powerpoint Ring Png
- Calendars - Vector stencils library | Economic Calendar | Business ...
