This site uses cookies. By continuing to browse the ConceptDraw site you are agreeing to our Use of Site Cookies.

Competitor Analysis

Competitor analysis is a first and obligatory step in elaboration the proper corporate marketing strategy and creating sustainable competitive advantage. Use powerful opportunities of numerous solutions from ConceptDraw Solution Park for designing illustrative diagrams, charts, matrices which are necessary for effective competitor analysis.

Organizational Structure

It is not an easy to task to visualize an organizational structure of any company or institution. Sometimes organisational structure could enclose more than thousand persons which work in different departments. Any types of organizational structure can be presented in the form of an organizational chart which creation is supported by ConceptDraw. There are many methods of structuring an organization, determining how it might operate. Often the organizational structure adapts to the production process depending on the type of production and kind of production. The choice of the method depends on the business objectives, dealing with the fact that in the future it will affect organizational action in many ways. First, the structure provides the foundation for standard working operations. Second, it defines the group of people making key decisions in the company, and the extent to which their point of view affects the activities of the organization.

Chart Templates

Easy charting software comes with beautiful chart templates and examples. This makes it easy to create professional charts without prior experience.

Donut Chart Templates

These donut chart templates was designed using ConceptDraw DIAGRAM diagramming and vector drawing software extended with Pie Charts solution from Graphs and Charts area of ConceptDraw Solution Park.
All these donut chart templates are included in the Pie Charts solution.
You can quickly rework these examples into your own charts by simply changing displayed data, title and legend texts.

Pie Chart Examples and Templates

A pie chart or a circle graph is a circular chart divided into sectors, illustrating numerical proportion. In a pie chart, the arc length of each sector and consequently its central angle and area, is proportional to the quantity it represents.

Pie chart examples and templates created using ConceptDraw DIAGRAM software helps you get closer with pie charts and find pie chart examples suite your needs.

Must Have Suggestion

This action mindmap helps respond to feature suggestions made by customers or enhancement requirements related to must-have features. The example contains ready to use response phrases organized into mindmap for quick composing and tweeting/posting of the response messages.

bubble diagram, circle-spoke diagram, marketing diagrams, circular arrows diagrams, segmented cycle diagram, Venn diagram, draw logical relations Business Diagrams

bubble diagram, circle-spoke diagram, marketing diagrams, circular arrows diagrams, segmented cycle diagram, Venn diagram, draw logical relations
The Business Diagrams Solution extends ConceptDraw DIAGRAM with an extensive collection of professionally designed illustrative samples and a wide variety of vector stencils libraries, which are the real help for all business-related people, business analysts, business managers, business advisers, marketing experts, PR managers, knowledge workers, scientists, and other stakeholders allowing them to design the bright, neat, expressive and attractive Bubble Diagrams, Circle-Spoke Diagrams, Circular Arrows Diagrams, and Venn Diagrams with different quantity of sets in just minutes; and then successfully use them in documents, reports, statistical summaries, and presentations of any style.

sales process map, sales process flowchart, sales steps, sales process management Sales Flowcharts

sales process map, sales process flowchart, sales steps, sales process management
The Sales Flowcharts solution lets you create and display sales process maps, sales process workflows, sales steps, the sales process, and anything else involving sales process management.

quality management mind map, quality management mindmap Quality Mind Map

quality management mind map, quality management mindmap
This solution extends ConceptDraw MINDMAP software with Quality Management Mind Maps (Presentations, Meeting Agendas, Problem to be solved).
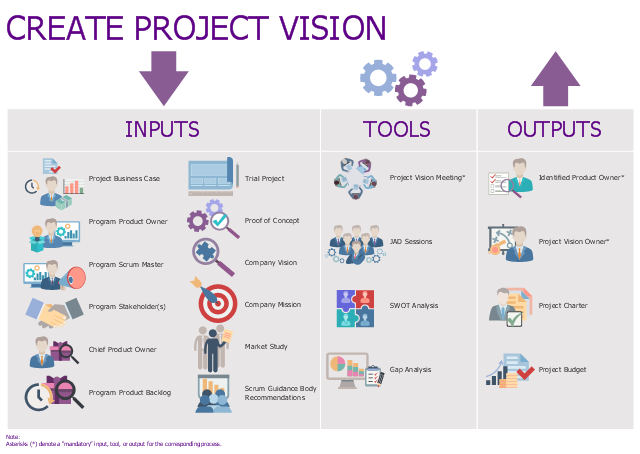
This infographic example was designed on the base of Fig. 8-3 "Create Project Vision — Inputs, Tools, and Outputs " on the page 137 of the "A Guide to the SCRUM BODY OF KNOWLEDGE (SBOK™ Guide) 2016 Edition".
" Create Project Vision — In this process, the Project Business Case is reviewed to create a Project Vision Statement that will serve as the inspiration and provide focus for the entire project. The Product Owner is identified in this process."
[scrumstudy.com/ SBOK/ SCRUMstudy-SBOK-Guide-2013.pdf]
This example of agile software development infographic was created using the ConceptDraw PRO software extended with the Scrum solution from the Project Management area of ConceptDraw Solution Park.
Infographic
Infographic, whole team, unit testing, team velocity chart, team member, team lead, stakeholder, sprint retrospective meeting, sprint demo, review meeting, scrum theme, scrum task board, scrum meeting, scrum maturity, scrum master, return on investment (ROI), requirements analysis, requirement, prototyping, program optimization, product review, product owner, operations staff, objective, light bulb, integration testing, integration, duration, drawing shapes, customer, commitment-based planning, check, banknote bundle, arrow up, arrow down, Definition of Done, DoD, BI tools,

Genomics

Genetic engineering is moving in a rapid fashion. There are new discoveries occurring at an incredibly fast pace.

This map was created from content found at "FAQ About Genetic and Genomic Science" (National Human Genome Research Institute, www.genome.gov) and shows how simple in is to use a map structure to explain complex subjects. The content from this map and maps similar to this can be used with the eLearning for Skype solution for ConceptDraw MINDMAP to present complex information in a simplified manner.

target diagram, circular diagram, circle diagram Target and Circular Diagrams

target diagram, circular diagram, circle diagram
This solution extends ConceptDraw DIAGRAM software with samples, templates and library of design elements for drawing the Target and Circular Diagrams.

Best Program to Create a Fowchart

ConceptDraw - feature-rich flowchart software allows you create professional looking flowcharts.

125 Ways to Integrate Social Media to Increase Your Business

This mind map illustrates modern social media approaches to business marketing that can be presented to others using ConceptDraw MINDMAP and the eLearning for Skype solution.

Circular Arrows

The Circular Arrows Diagrams are very popular in management and marketing. They are the useful way to visualize a sequence of steps, tasks, or events as a circular flow. But how design the Circular Arrows Diagram quick and easy? You will need a powerful software. ConceptDraw DIAGRAM diagramming and vector drawing software is exactly what you need. Extended with Circular Arrows Diagrams solution from the "Diagrams" Area, ConceptDraw DIAGRAM is the best for drawing the Circular Arrows Diagrams.

How To use Switches in Network Diagram

Special libraries of highly detailed, accurate shapes and computer graphics, servers, hubs, switches, printers, mainframes, face plates, routers etc.
Use ConceptDraw DIAGRAM with Computer & Networks solution for drawing LAN and WAN topology and configuration diagrams, Cisco network diagrams, network wiring schemes and floor plan layouts.

Human Resources

Human resources is the set of individuals who make up the workforce of an organization, business sector, or economy. ConceptDraw DIAGRAM diagramming and vector drawing software extended with unique HR Flowcharts Solution from the Management Area of ConceptDraw Solution Park is the best for designing various flowcharts and diagrams in the field of human resources management.

Discover Plans Question

This action mindmap helps respond to questions related to plans discovered from customers asking about future products or services of the company. The example contains ready to use response phrases organized into mindmap for quick composing and tweeting/posting of the response messages.