ConceptDraw PRO 9 Comparison with Omnigraffle Professional and MS Visio
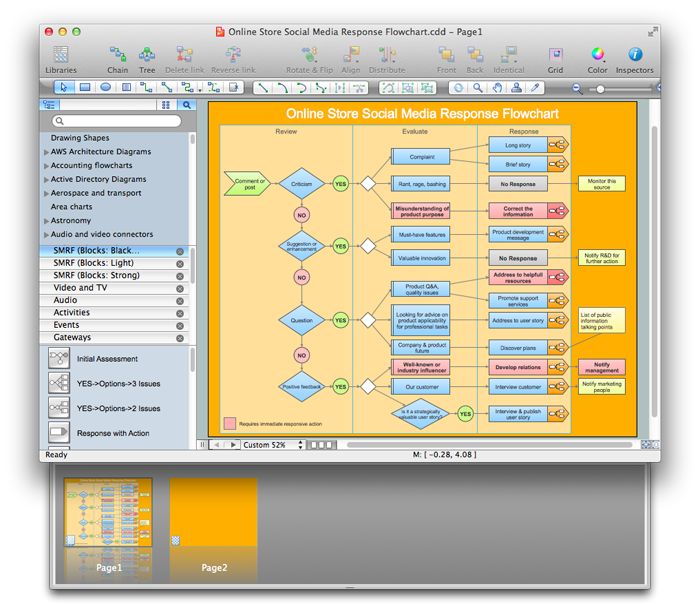
ConceptDraw PRO comparison with Omnigraffle Professional and MS Visio shows you the significant benefits of ConceptDraw PRO, which offers varied useful drawing tools, the capability of creation multi-page documents, wide export / import capabilities in graphic formats, integration with Visio and Microsoft Office applications, availability of built-in scripting language and ConceptDraw Solution Park with numerous solutions, vector objects libraries, templates and samples. Business today is conducted with incredible rate and dynamic presentations become very popular. Sometimes while conducting the business, may happen that you can't describe some situation, state, or process with only words. In these cases it is convenient to include graphics and diagrams associated with the text. This guarantees successful communication with other stakeholders and team members, and faultless understanding the information by them. The combination of words and graphics is ideal combination, it improves the clarity and removes any doubt. ConceptDraw PRO helps you easy create any kinds of diagrams and dynamic presentations too.Comparing ConceptDraw PRO to Omnigraffle
Comparing ConceptDraw PRO to Omnigraffle you can see a lot of benefits of ConceptDraw products. First the main, ConceptDraw applications are cross-platform and available in two independent and concurrent versions for Macintosh (OS X) and PC (Windows). ConceptDraw gives you the per named license, that you can use simultaneously for your both Macintosh and PC, at work and at home. Free access to the ConceptDraw Solution Park offers you great number of solutions with hundreds of templates and samples, and thousands of ready-to-use vector objects for quick and easy creation diagrams, drawings, illustrations and Mind Maps. Besides, thanks to the Ingyre Technology is provided the integration with Microsoft Office applications and capabilities of limitless exchange the information. The ConceptDraw Live Objects technology lets you design the visual dynamically-updated dashboards, the Rapid Draw technology allows create the diagrams in minutes. The extensive presentation capabilities help you create lush and beautiful presentation slideshows from your ConceptDraw documents.
 Comparison Dashboard
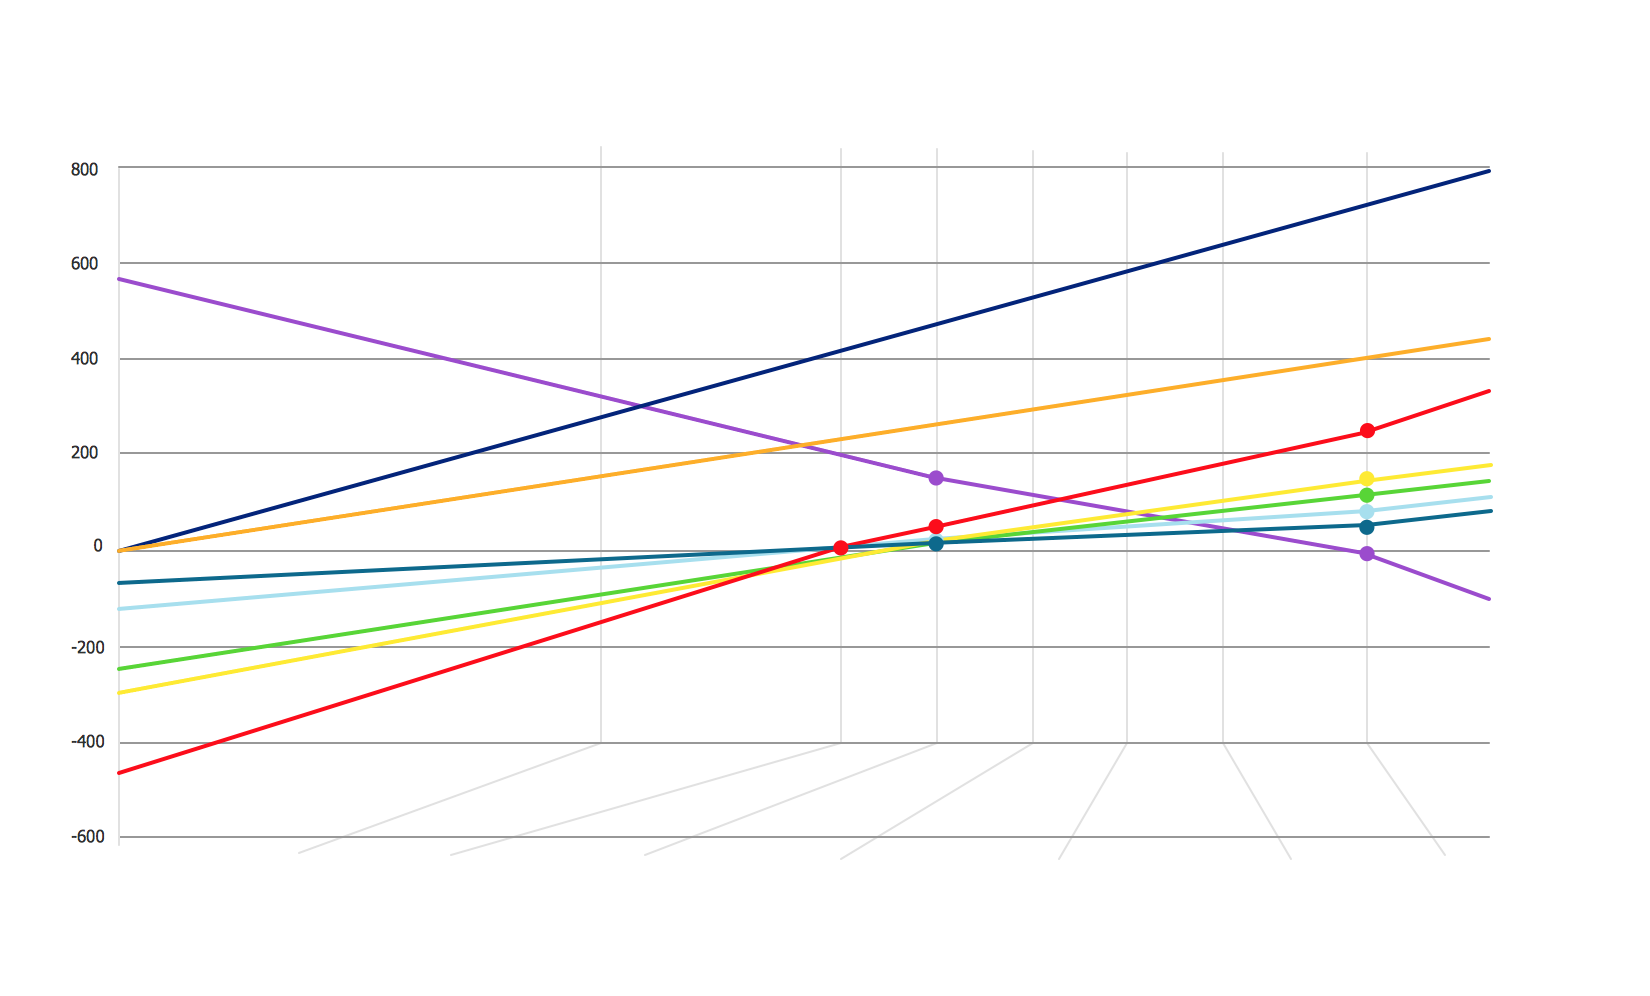
Comparison dashboard solution extends ConceptDraw PRO software with samples, templates and vector stencils library with charts and indicators for drawing the visual dashboard comparing data.
Financial Comparison Chart
This sample shows the Bar Chart of the leverage ratios for two major investment banks. The leverage ratio is the ratio of the total debt to the total equity; it is a measure of the risk taken by the bank. The higher of the leverage ratio denotes the more risk, the greater risks can lead to the subprime crisis.Comparison List
This sample was created in ConceptDraw PRO diagramming and vector drawing software using the Basic Diagramming Solution from the Universal Diagramming area of ConceptDraw Solution Park.Feature Comparison Chart Software
An example of marketing analysis diagram, can be used to analyse product market and define marketing strategy. This sample shows the Feature Comparison Chart of the digital scouting cameras. It can be useful for digital cameras production field, marketing, sales, etc.Competitor Analysis
Competitor analysis is a first and obligatory step in elaboration the proper corporate marketing strategy and creating sustainable competitive advantage. Use powerful opportunities of numerous solutions from ConceptDraw Solution Park for designing illustrative diagrams, charts, matrices which are necessary for effective competitor analysis.HelpDesk
How to Track Your Project Plan vs. the Actual Project Condition
Conceptdraw PROJECT provides user with the possibility to track how the project is going. Project Manager can compare the actual data with the planned and assess possible measures to resolve issues. Conceptdraw PROJECT has several types of visual reports that can help to assess visually the difference between planned and actual project data.Looking at ConceptDraw MINDMAP as a Replacement for Mindjet Mindmanager
The comparing of ConceptDraw MINDMAP to Mindjet Mindmanager allows to identify a lot of benefits. At first, the ConceptDraw MINDMAP has a lower price, the flexible licensing, the license is per-named-user, no charge for major product upgrades and no charge for support. ConceptDraw MINDMAP is effective for launching the stalled projects to new heights, it possess the excellent possibility of importing and exporting to other mind mapping program file formats. ConceptDraw MINDMAP easily integrates with wide set of programs, among them Evernote, Skype, Twitter, Microsoft Word, Microsoft PowerPoint, Microsoft Project, Mindjet Mindmanager, ConceptDraw PROJECT, ConceptDraw PRO, with solutions from ConceptDraw Solution Park. Now you have a freedom to choose the best format for each your document, it is incredibly easy to make the Skype presentation, to take and share critical information, to send your Mind Map to Evernote, to import / export MS Word documents, MS PowerPoint presentations, the project data, open and save Mindmanager files, to map out the long-term Twitter messages and publish them to your Twitter account directly from a Mind Map.HelpDesk
How to Convert a Visio Stencils for Use in ConceptDraw PRO
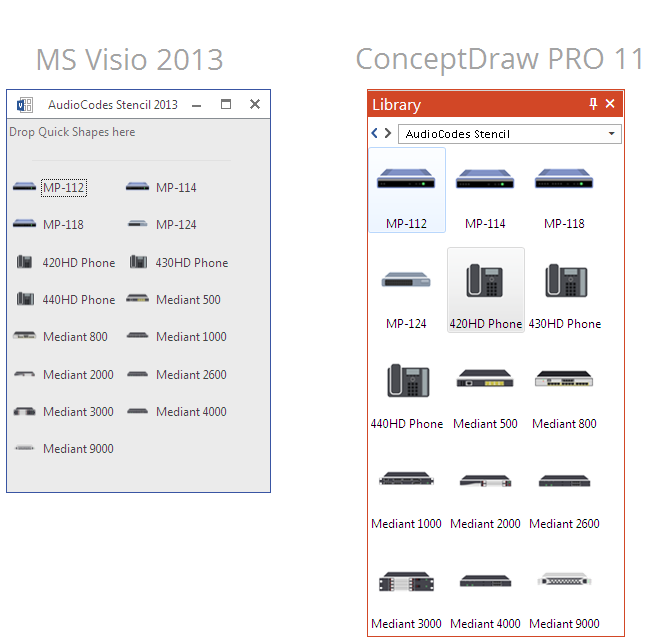
MS Visio provides users with a number of predefined stencils. Standard Visio stencils contain shapes that are basically used to create diagrams. The shapes can range from simple flow chart boxes or lines to more complicated shapes like servers, racks or anything else that needs to be represented in a graphical form. ConceptDraw PRO supports the possibility to open Visio stencils. With the introduction of Visio 2013 Microsoft has changed the native file format used in earlier versions of Microsoft Visio. Thus, when you are looking for professional tool to open and save in the newer Visio 2013 file format on Mac, ConceptDraw PRO v10 is exactly solution for you. ConceptDraw PRO v10 file import and export works round-trip with the new Visio VSDX file format and at the same time supports the improved import of VDX file format. To use Visio stencils created with MS Visio 2010 in your diagrams, created with ConceptDraw PRO, follow the steps described in the following article.- Visio Compare Diagrams
- Visio Porcesses Comparison Chart Templates
- Comparison Symbol In Flowchart
- Data structure diagram with ConceptDraw PRO | MS Visio Look a ...
- Is ConceptDraw PRO an Alternative to Microsoft Visio ...
- Professional Diagram and Flowchart Software | Compare The Using ...
- Flowchart Symbol For Comparison
- KPI Dashboard | Dashboard | Sales Dashboard | Dashboard Visio
- Comparing ConceptDraw PRO to Omnigraffle | Basic Flowchart ...
- Comparing ConceptDraw PRO to Omnigraffle | Comparison ...


