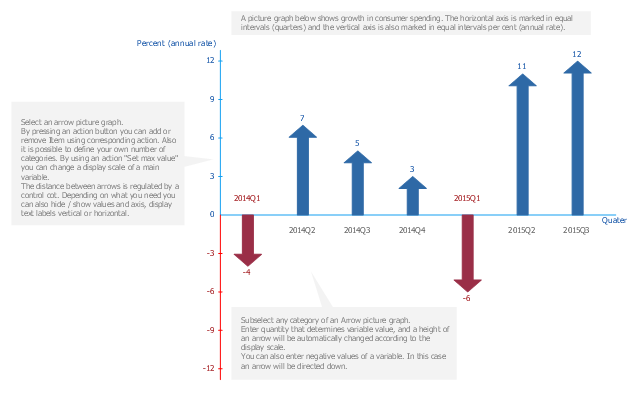
A picture chart (image chart, pictorial graph) is the type of a bar graph visualizing numarical data using symbols and pictograms.
In the field of economics and finance use a picture graph with columns in the form of coins. For population comparison statistics use a chart with columns in the form of manikins. To show data increase or decrease use arrows bar charts.
The arrow chart template "Picture graph" for the ConceptDraw PRO diagramming and vector drawing software is included in the Basic Picture Graphs solution from the Graphs and Charts area of ConceptDraw Solution Park.
- Comparison Chart Template Excel
- Visio Porcesses Comparison Chart Templates
- Feature Comparison Chart Software | Marketing | Financial ...
- Feature Comparison Chart Software | Bar Chart Template for Word ...
- Sales Growth. Bar Graphs Example | Financial Comparison Chart ...
- Financial Comparison Chart | Bar Graph | Bar Chart Template for ...
- Financial Comparison Chart | Bar Chart Template for Word | Sales ...
- Picture graph - Template | Manufacturing in America | Total value of ...
- Bar Graphs | Column Chart Template | Financial Comparison Chart ...
