 Marketing
This solution extends ConceptDraw DIAGRAM and ConceptDraw MINDMAP with Marketing Diagrams and Mind Maps (brainstorming, preparing and holding meetings and presentations, sales calls).
 PM Agile
PM Agile solution provides powerful tools for project management, project planning and software development, ensuring support of Agile methods, assisting in holding the Scrum-meetings, collaborative planning sprints, maintaining backlog, calculating and reporting the velocity of the team. Intended for the companies using Agile methodology, specifically Scrum, Product Owners, Scrum Masters, software developers, and management specialists, this solution includes examples demonstrating the main principles of Agile methodology and Scrum, and numerous templates specially developed in ConceptDraw DIAGRAM and ConceptDraw MINDMAP applications. All Agile meetings and documents are powered by the mission of adapted Mind Map templates, tuned for collaborative work of development team. The key diagrams for visualization are made in ConceptDraw DIAGRAM.
 Comparison Dashboard
Comparison dashboard solution extends ConceptDraw DIAGRAM software with samples, templates and vector stencils library with charts and indicators for drawing the visual dashboard comparing data.
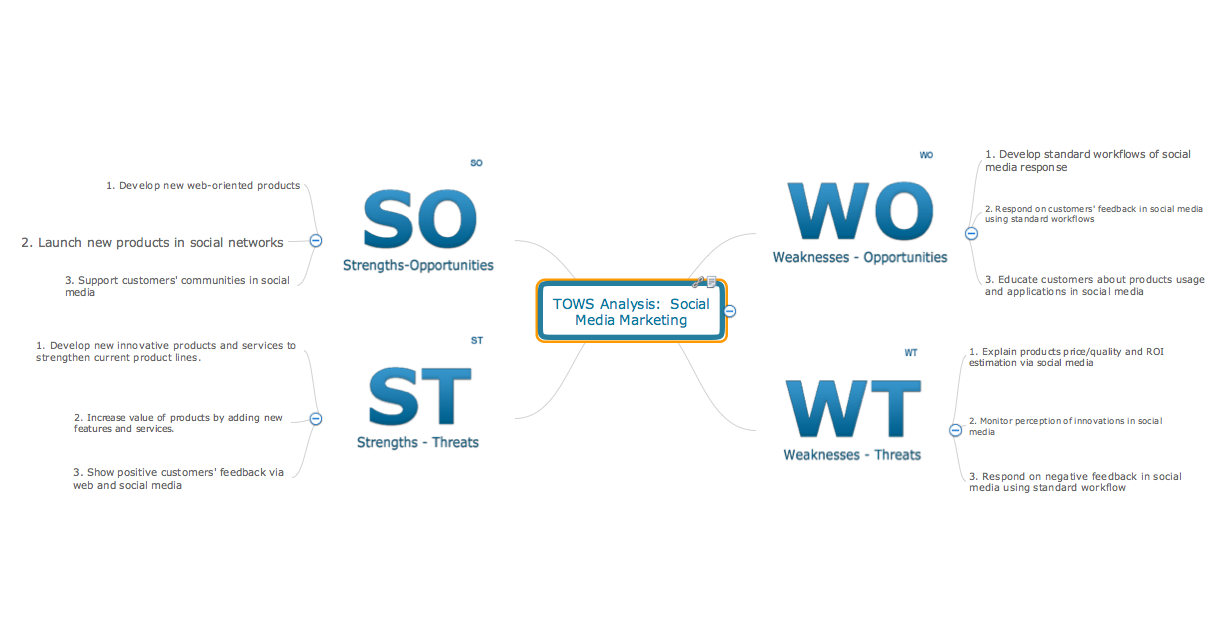
SWOT analysis Software & Template for Macintosh and Windows

SWOT matrix template

 Fishbone Diagram
Fishbone Diagrams solution extends ConceptDraw DIAGRAM software with templates, samples and library of vector stencils for drawing the Ishikawa diagrams for cause and effect analysis.
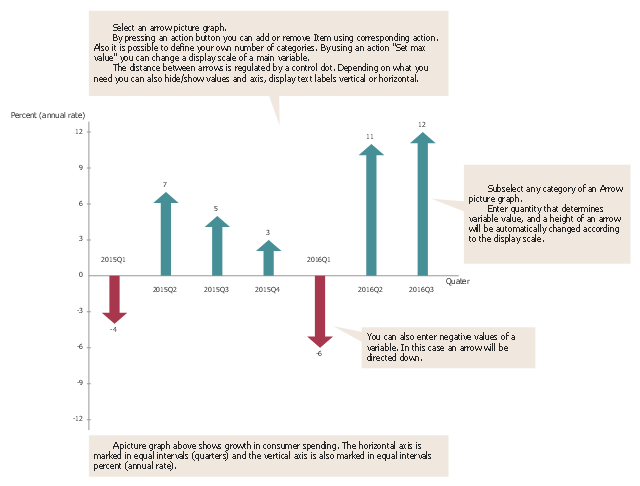
A picture chart (image chart, pictorial graph) is the type of a bar graph visualizing numarical data using symbols and pictograms.
In the field of economics and finance use a picture graph with columns in the form of coins. For population comparison statistics use a chart with columns in the form of manikins. To show data increase or decrease use arrows bar charts.
The picture graph template for the ConceptDraw PRO diagramming and vector drawing software is included in the Picture Graphs solution from the Graphs and Charts area of ConceptDraw Solution Park.
Arrows bar chart template
SWOT Analysis Software

Comparing ConceptDraw DIAGRAM to Omnigraffle

 Matrices
This solution extends ConceptDraw DIAGRAM software with samples, templates and library of design elements for drawing the business matrix diagrams.
SWOT Analysis Solution - Strategy Tools

SWOT Analysis
 Management
This solution extends ConceptDraw DIAGRAM and ConceptDraw MINDMAP with Management Diagrams and Mind Maps (decision making, scheduling, thinking ideas, problem solving, business planning, company organizing, SWOT analysis, preparing and holding meetings
SWOT Sample in Computers

- Marketing | Feature comparison chart - Digital scouting cameras ...
- Feature comparison chart - Digital scouting cameras | Marketing ...
- Chore charts with ConceptDraw PRO | Weekly to-do chore chart ...
- Marketing | SWOT Analysis Solution - Strategy Tools | Comparison ...
- Matrices | Feature comparison chart - Digital scouting cameras ...
- Feature comparison chart - Digital scouting cameras | Matrices ...
- SWOT analysis Software & Template for Macintosh and Windows ...
- Marketing | Fishbone Diagram | Business diagrams & Org Charts ...
- Matrices | Seven Management and Planning Tools | Feature ...
- Marketing | Comparison Dashboard | Fishbone Diagram |
- SWOT Analysis Software | SWOT Sample in Computers | Software ...
- Sales Dashboard Template | Meter Dashboard | Composition ...
- Pie chart template
- Matrices | Seven Management and Planning Tools | SWOT Sample ...
- Composition Dashboard | What is a Dashboard Area | Comparison ...
- Deployment chart template
- Pyramid diagram template | Triangle diagram template | Pyramid ...
- Picture Graphs | Picture graph template | How to Draw an ...
- Marketing | Software for Creating SWOT Analysis Diagrams | SWOT ...