 Marketing
This solution extends ConceptDraw PRO v9 and ConceptDraw MINDMAP v7 with Marketing Diagrams and Mind Maps (brainstorming, preparing and holding meetings and presentations, sales calls).
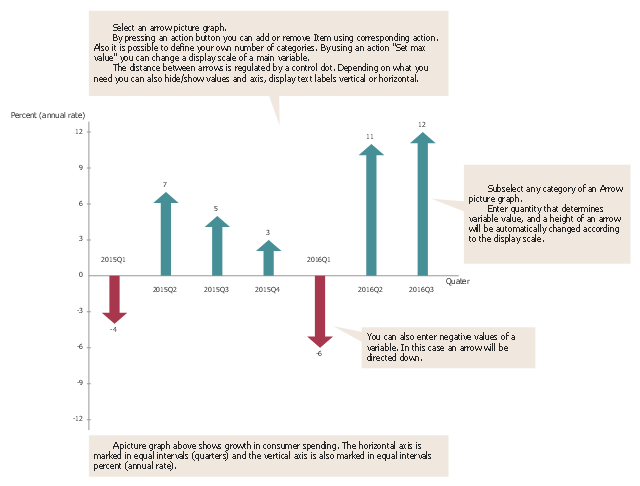
A picture chart (image chart, pictorial graph) is the type of a bar graph visualizing numarical data using symbols and pictograms.
In the field of economics and finance use a picture graph with columns in the form of coins. For population comparison statistics use a chart with columns in the form of manikins. To show data increase or decrease use arrows bar charts.
The picture graph template for the ConceptDraw PRO diagramming and vector drawing software is included in the Picture Graphs solution from the Graphs and Charts area of ConceptDraw Solution Park.
 Fishbone Diagram
Fishbone Diagrams solution extends ConceptDraw PRO software with templates, samples and library of vector stencils for drawing the Ishikawa diagrams for cause and effect analysis.
 Comparison Dashboard
Comparison dashboard solution extends ConceptDraw PRO software with samples, templates and vector stencils library with charts and indicators for drawing the visual dashboard comparing data.
 PM Agile
This solution extends ConceptDraw PRO software. All Agile meetings and documents are powered by mission adapted mind map templates, specially tuned for collaborative work.
 Maps
Maps
This solution extends ConceptDraw PRO v9.4 with the specific tools necessary to help you draw continental, directional, road, or transit maps, to represent international, business, or professional information visually.
 SWOT Analysis
SWOT and TOWS Matrix Diagrams solution extends ConceptDraw PRO and ConceptDraw MINDMAP software with features, templates, samples and libraries of vector stencils for drawing SWOT and TOWS analysis matrices and mind maps.
 Total Quality Management TQM Diagrams
Total Quality Management Diagrams solution extends ConceptDraw PRO software with samples, templates and vector stencils library for drawing the TQM flowcharts.
- Deployment matrix chart template | Competitive feature comparison ...
- SWOT analysis Software & Template for Macintosh and Windows ...
- Marketing | Comparison Dashboard | Fishbone Diagram |
- Matrices | Feature comparison chart - Digital scouting cameras ...
- Marketing | SWOT analysis matrix diagram templates | Comparison ...
- Marketing | SWOT analysis Software & Template for Macintosh and ...
- Marketing | PM Agile | Comparison Dashboard | - Conceptdraw.com
- Marketing | Feature comparison chart - Digital scouting cameras ...
- SWOT analysis Software & Template for Macintosh and Windows ...
- SWOT analysis Software & Template for Macintosh and Windows ...
- Matrices | Marketing | Feature comparison chart - Digital scouting ...
- Marketing | Matrices | Pie chart template |
- Marketing | SWOT analysis Software & Template for Macintosh and ...
- SWOT analysis Software & Template for Macintosh and Windows ...
- Chore charts with ConceptDraw PRO | Weekly to-do chore chart ...
- SWOT analysis matrix diagram templates | Marketing | Financial ...
- Marketing | SWOT analysis matrix diagram templates | SWOT ...
- Marketing | Fishbone Diagram | SWOT analysis Software ...
- Feature comparison chart - Digital scouting cameras | Matrices ...
- Chore charts with ConceptDraw PRO | Weekly to-do chore chart ...
