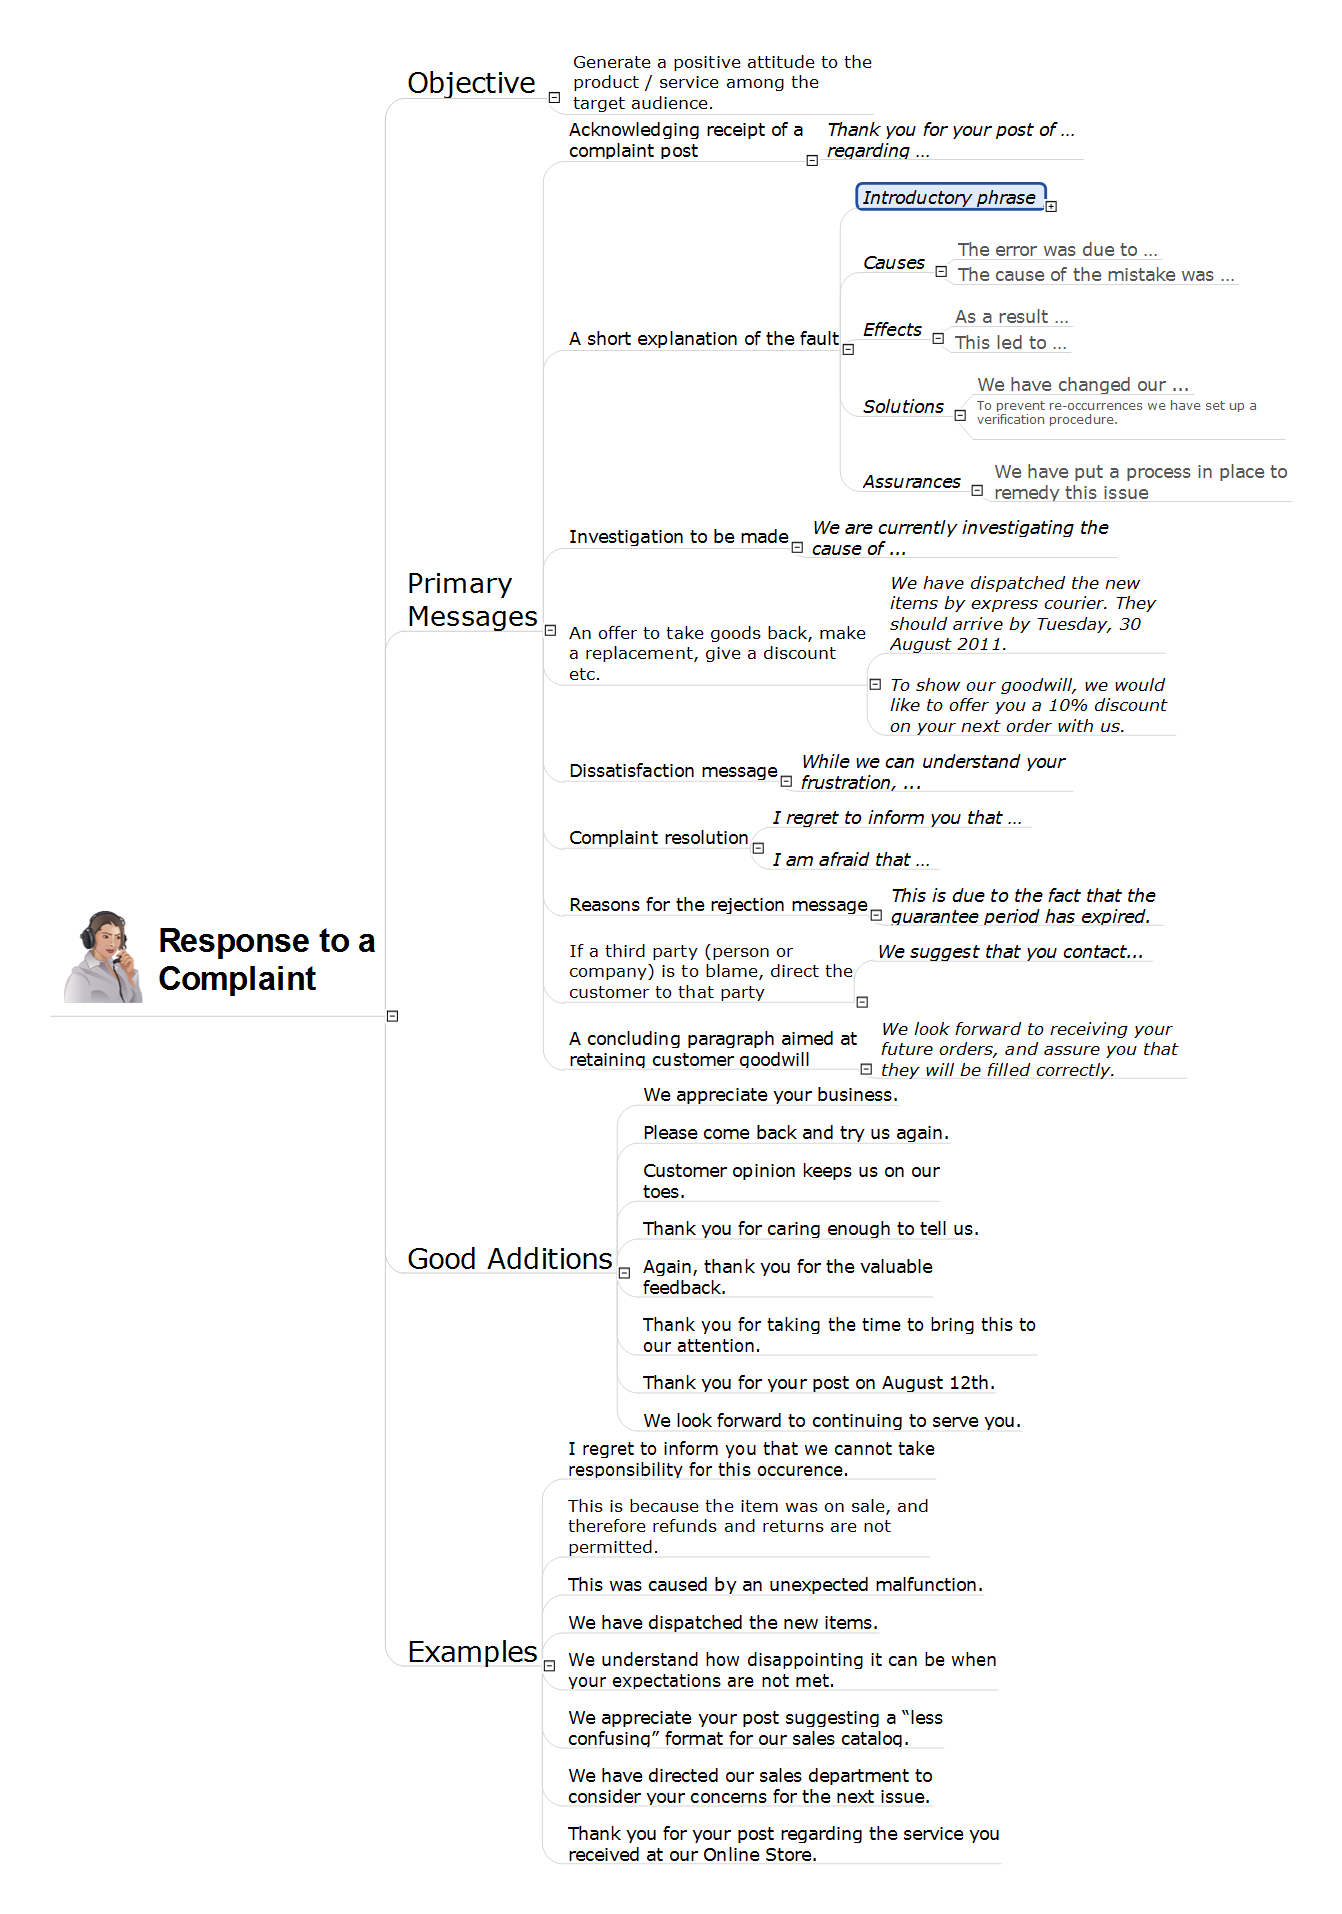
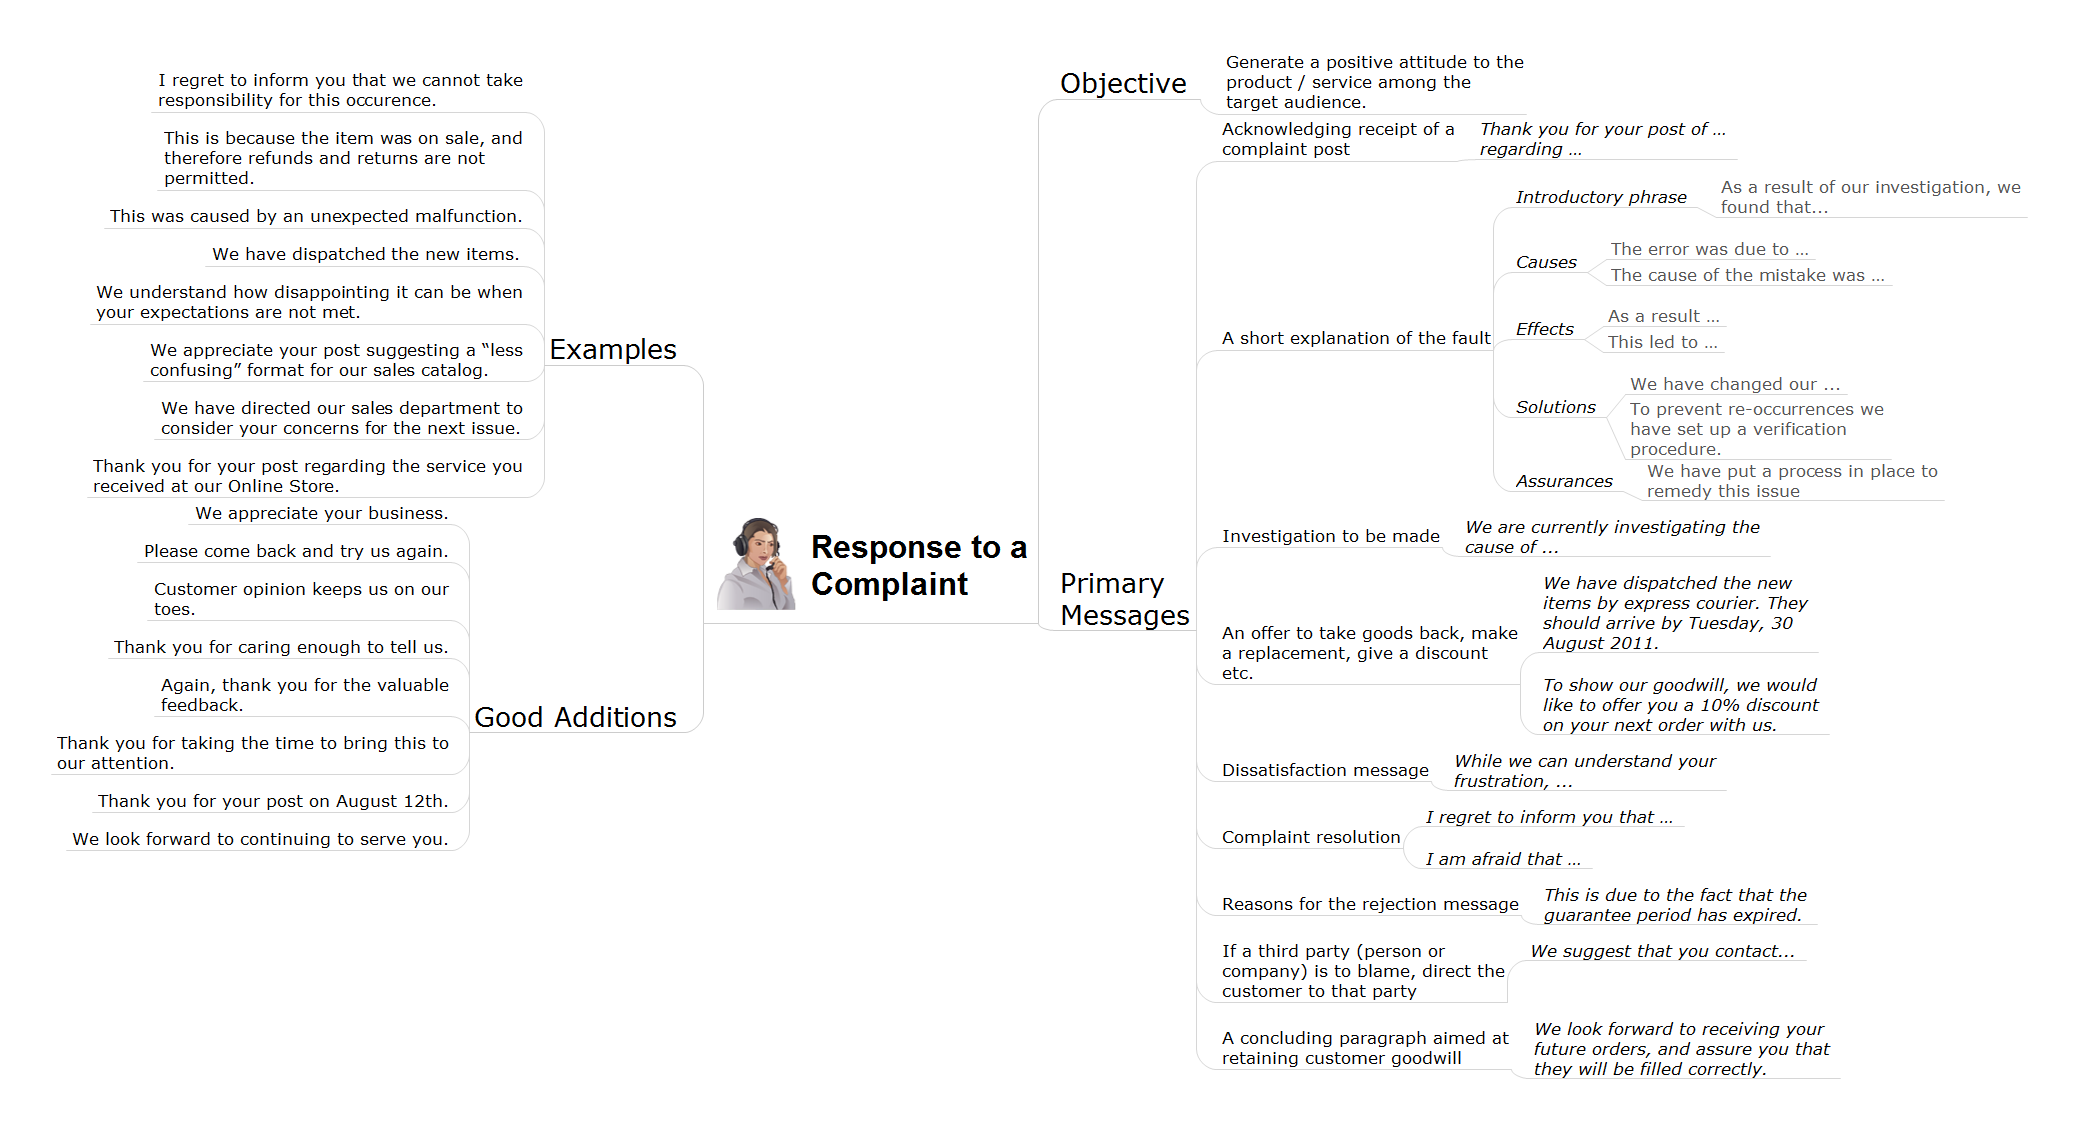
Response to Complaint
Every company that exists on the market, at least once was faced with a written complaint of its client. Typically, this is unexpectedness, but you need to be well prepared for this, because from what how you will respond to the complaint depends the success of your future cooperation with these clients and many others. Moreover, the dealing with complaints is a clear indication of how you are able to work with clients and how you appreciate them. The negative reviews can easy scare away new customers, so if any person appealed for you with a complaint, your task is as quickly as possible to resolve the situation, to show the client that you listen to his wishes, quickly react to them and correct your mistakes. The disregard of upset people is unacceptable and could lead to the sad consequences. And vice versa, the correct response to the claim helps to settle the dispute, to keep the situation under the control, to save time, to restore the reputation and to keep the client base. This action Mind Map designed in ConceptDraw MINDMAP effectively helps to quickly respond to customer complaints and contains a variety of short or long response messages.Sales Process Flowchart Symbols
The most easier way of creating the visually engaging and informative Sales Process Flowchart is to create the new ConceptDraw document and to use the predesigned vector symbols offered in 6 libraries of the Sales Flowchart Solution. There are more than six types of sales process flow diagrams, ConceptDraw DIAGRAM software is flowchart maker which include six collections of extended flowchart symbols for effective diagramming. There are main collections of color coded flowchart symbols: Sales Department, Sales Steps, Sales Workflow, Sales Symbols and special set of Sales Arrows and Sales Flowchart.What Helps to Organize the Process
ConceptDraw will make your own social media and content marketing efforts more successful.How to Create a Social Media DFD Flowchart
The use of social media in modern conditions helps the companies to be more effective in timely messaging - actively and rapidly response to a customer posts in social media, to find quickly the appropriate response to social media mentions, to save greatly the budget. Many companies even use the social media as a lead tool for promotion. But how to create a Social Media DFD Flowchart, Social Media Response Flowchart or Action Mind Map fast and easy? ConceptDraw DIAGRAM ector graphical software and Social Media Response solution included to ConceptDraw Solution Park assist greatly in their creation. This solution improves the quality of content in social media and helps to build an active customer community. The samples and examples included to Social Media Response solution are helpful for social media teams in developing a social media strategy, in refining and organizing the response process, in creation training materials by trainers and consultants for education the social media groups on how to accomplish the most effectiveness in their daily work.Create Response Charts
Visual navigation through the stages of a response process helps you locate specific actions to be taken via Action Mind Maps. Use ConceptDraw DIAGRAM and ConceptDraw MINDMAP for organize the process of response for interactions occurring in social media.How to Use the ″Online Store PR Campaign″ Sample
Interactive tool helps you find the appropriate response to social media mentions quickly.
 Presentation Clipart
Presentation design elements solution extends ConceptDraw DIAGRAM software with slide samples, templates and vector stencils libraries with design elements of presentation symbols, arrows, callouts, backgrounds, borders and frames, title blocks.
ConceptDraw DIAGRAM : Able to Leap Tall Buildings in a Single Bound
ConceptDraw DIAGRAM is the world’s premier cross-platform business-diagramming tool. Many, who are looking for an alternative to Visio, are pleasantly surprised with how well they can integrate ConceptDraw DIAGRAM into their existing processes. With tens of thousands of template objects, and an easy method for importing vital custom objects from existing Visio documents, ConceptDraw DIAGRAM is a powerful tool for making extremely detailed diagrams, quickly and easily.Workflow Diagram Symbols
Workflow Diagram is an acknowledged method of drawing the processes and business processes, which uses the concerted set of symbols for depicting different kinds of steps or relations. Often it is named the Process Flow Diagram, but the real Process Flow Diagram uses different visual notations and different flowchart symbols. The professionally designed Workflow diagram also may be used for the same purpose as a Critical process flow diagram. Nevertheless, there are many cases when you may need to make your Workflow Diagram more bright and graphic. ConceptDraw DIAGRAM diagramming software extended with Workflow Diagrams solution from Business Processes area of ConceptDraw Solution Park possesses the powerful properties of software for Workflow diagram design. It delivers rich set of business process workflow diagram symbols, which help users to accurately diagram the workflow scenarios and to design great-looking and attractive Workflow Diagrams and Process Flow Diagrams better-suited for presentations, websites, reports, and other documents.UML Use Case Diagram Example. Social Networking Sites Project
UML Diagrams Social Networking Sites Project. This sample was created in ConceptDraw DIAGRAM diagramming and vector drawing software using the UML Use Case Diagram library of the Rapid UML Solution from the Software Development area of ConceptDraw Solution Park. This sample shows the Facebook Socio-health system and is used at the projection and creating of the social networking sites.- Customer Complaint Service Flow Chart
- Structure Of A Flow Chart Of Businesses Complaints
- Fishbone Diagram | Software Flowchart For Complaint System
- Process Flowchart | Basic Flowchart Symbols and Meaning | Flow ...
- Social Media Response | Complain Flowchart
- Basic Flowchart Symbols and Meaning | Work Order Process ...
- Basic Flowchart Symbols and Meaning | Process Flowchart ...
- Fish Bone Analysis For Customer Complaints
- How to Create a Social Media DFD Flowchart | How to Use the ...
- How to Create a Social Media DFD Flowchart | Presentation Clipart ...
- Providing telecom services - Cross-functional flowchart | Cross ...
- Customers Complaint Flow Chart
- Block diagram - Gap model of service quality | Process Flowchart ...
- Data Flow Diagram Customer Complaint
- Social Media Response | Social Media Complaints Diagram
- Usecasediagram For Complaint In Bank
- Tqm Flowchart Example
- Trouble ticket system - BPMN 2.0 diagram | Business Process ...
- Dfd Diagram For Registering Complaint
- Online Complaint Application By Government Office Diagram


