Fully Connected Network Topology Diagram
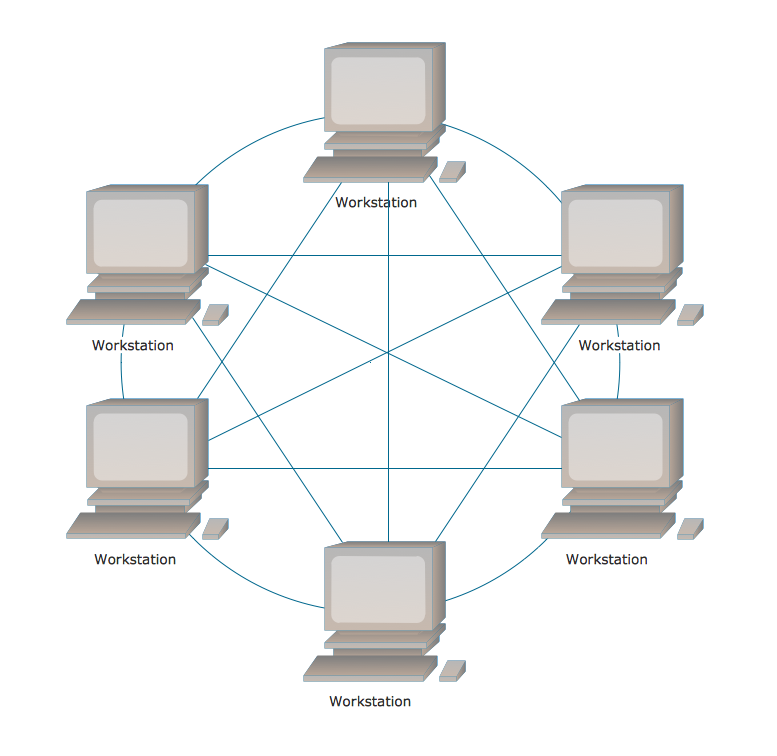
Fully Connected Network Topology (Complete topology, Full mesh topology) is a network topology characterized by existence of direct links between all pairs of nodes. The Fully connected network including n nodes, contains n(n-1)/2 direct links. This topology is mostly used in military applications. It is a quite expensive network technology and is extremely impractical for the large networks. But when it is set, it provides a high degree of reliability thanks to the large quantity of redundant links between nodes and so multiplicity of paths for the data. The two-node network is also considered as a Fully connected network. Computer Network Diagrams solution from Computer and Networks area of ConceptDraw Solution Park offers the predesigned vector stencils libraries, examples and templates for easy designing various Computer network topology diagrams for wired and wireless networks, including the Fully connected topology. This solution is intended to help computer network designers and engineers perfectly illustrate network documentation, reports, presentations, etc.Hierarchical Network Topology
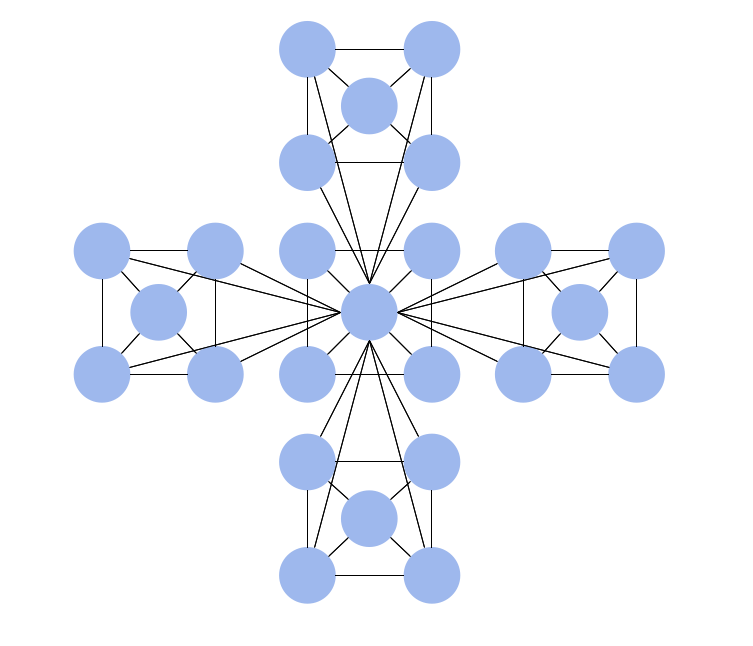
This sample was created in ConceptDraw DIAGRAM diagramming and vector drawing software using the Computer and Networks solution from Computer and Networks area of ConceptDraw Solution Park. This sample shows the Hierarchical network topology. A Hierarchical network topology interconnects multiple groups that are located on the separate layers to form a larger network. Each layer concentrates on the specified functions, this allows to choose the right equipment for the layer.Line Graph
ConceptDraw DIAGRAM extended with Line Graphs solution from Graphs and Charts area of ConceptDraw Solution Park is ideal software for quick and simple drawing professional looking line graph.Object-Oriented Design
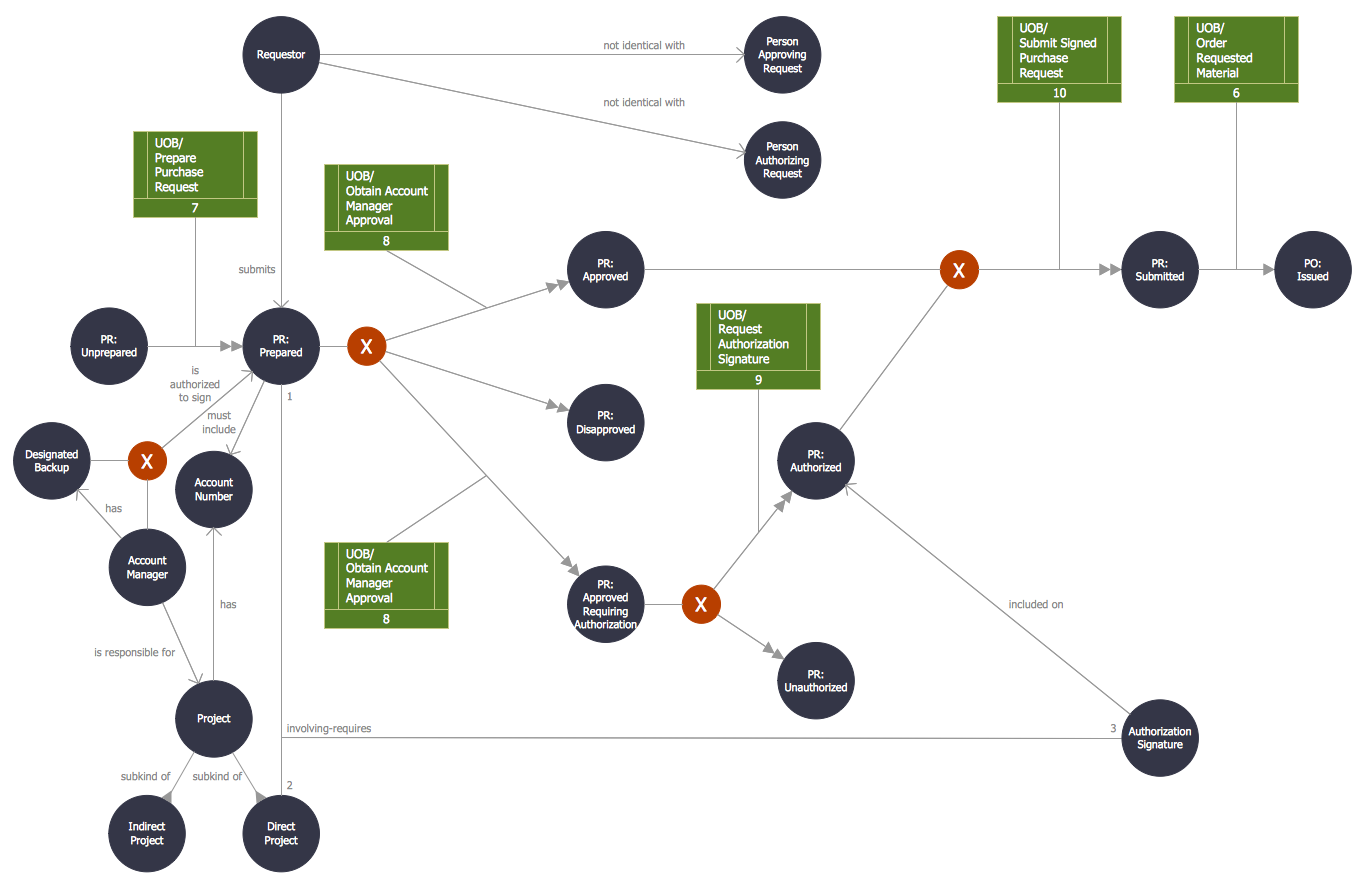
ConceptDraw DIAGRAM is a powerful diagramming and vector drawing software. Now, extended with IDEF Business Process Diagrams solution from the Business Processes area of ConceptDraw Solution Park it is incredibly helpful and convenient for object-oriented design.Block Diagram
The vector stencils libraries: Block Diagrams, Blocks with Perspective, Callouts, Connectors, Raised Blocks from the solution Block Diagrams contain specific block diagram symbols such as arrows, input/output symbols, start/end symbols, processing symbols, conditional symbols, commenting symbols, callouts, connectors, etc. for ConceptDraw DIAGRAM diagramming and vector drawing software. The Block Diagrams solution is contained in a "Diagrams" area of ConceptDraw Solution Park. Use the libraries from the Block Diagrams solution to draw block diagrams for your business documents, presentations and websites in a few minutes.Control and Information Architecture Diagrams (CIAD) with ConceptDraw DIAGRAM
One of the three main constituents of any enterprise is the Control and Information Architecture. The rest two are Production facilities and People and Organization.Organogram Software
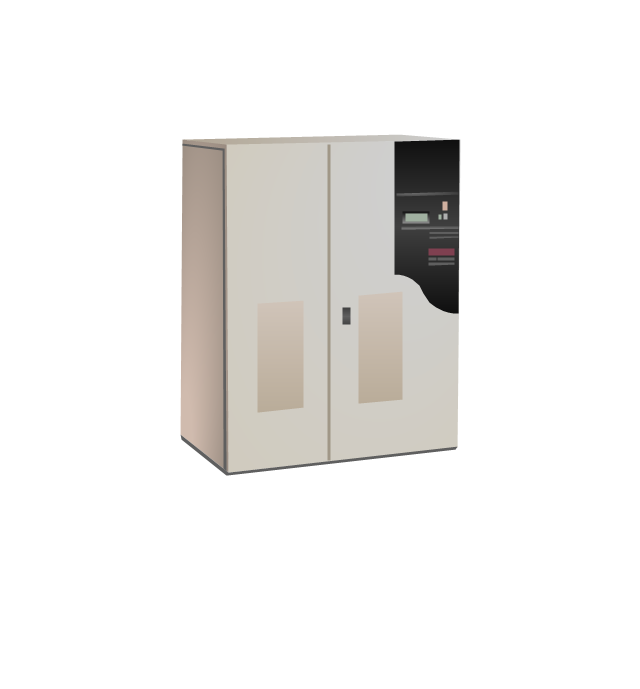
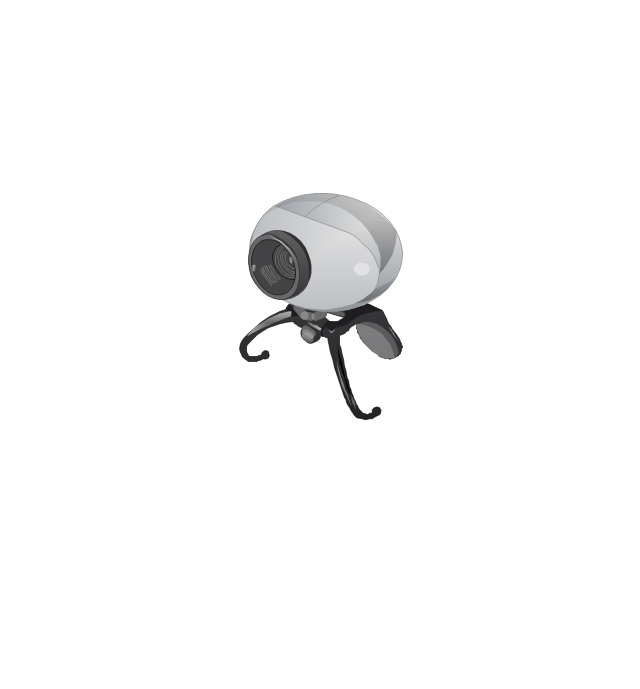
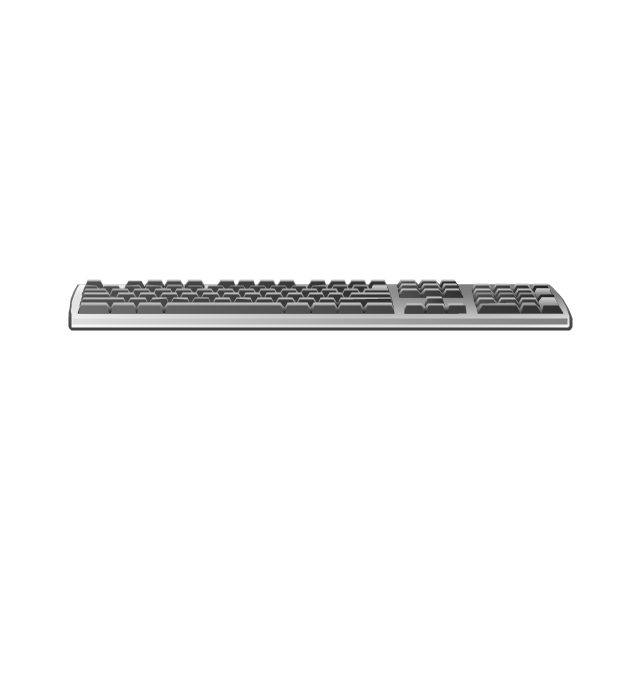
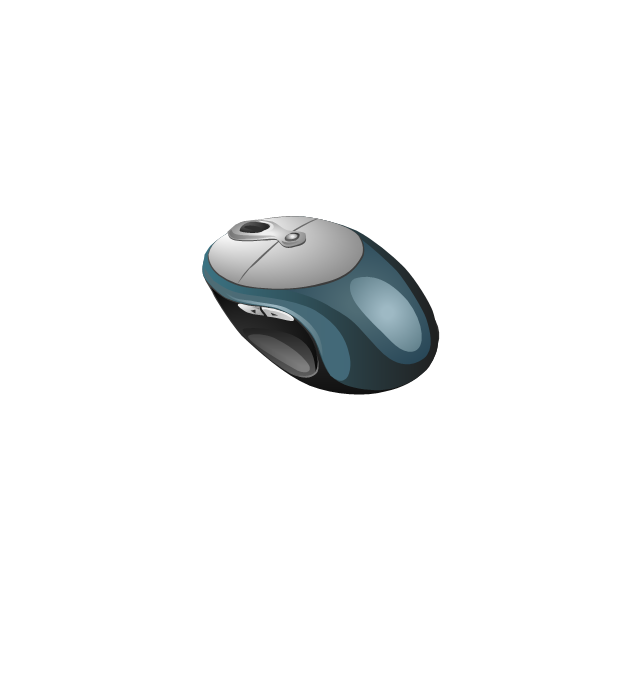
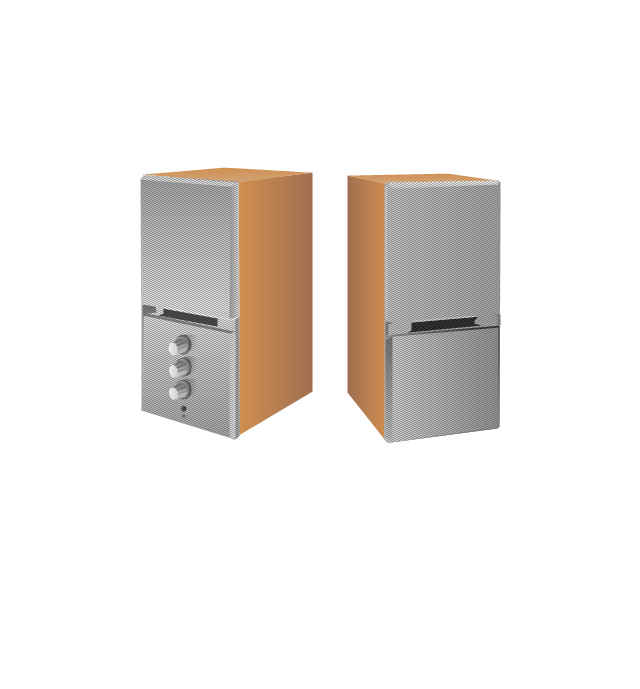
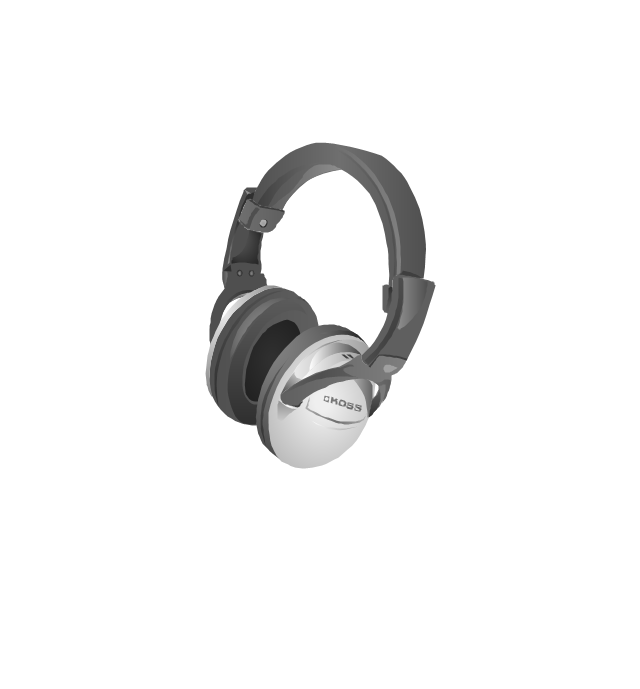
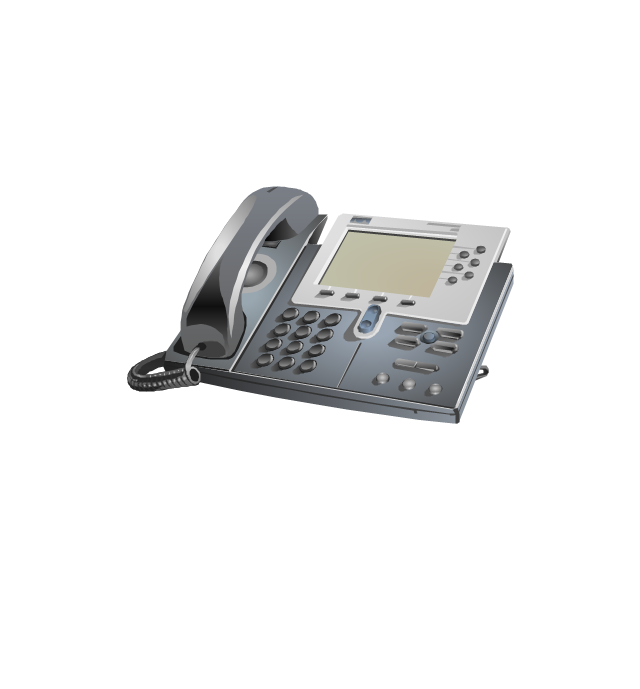
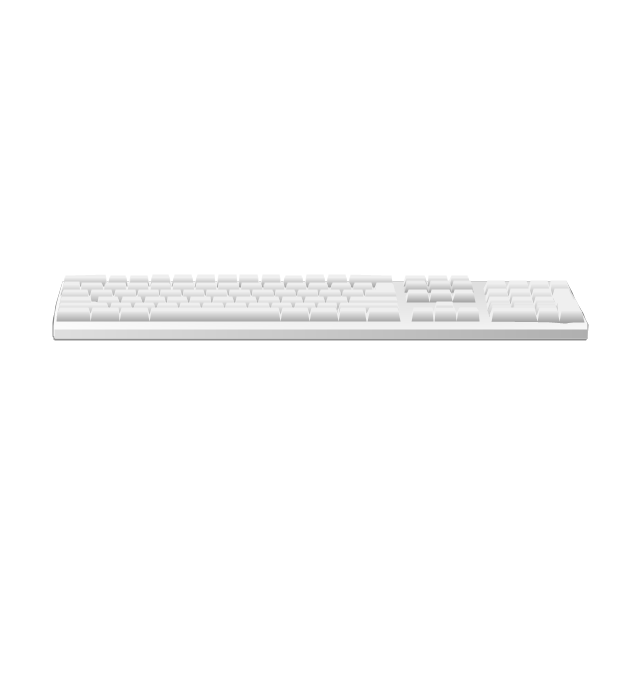
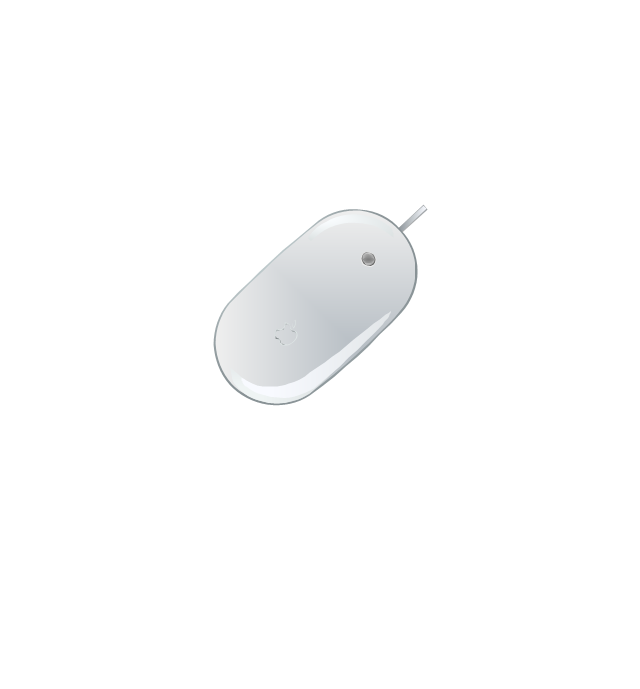
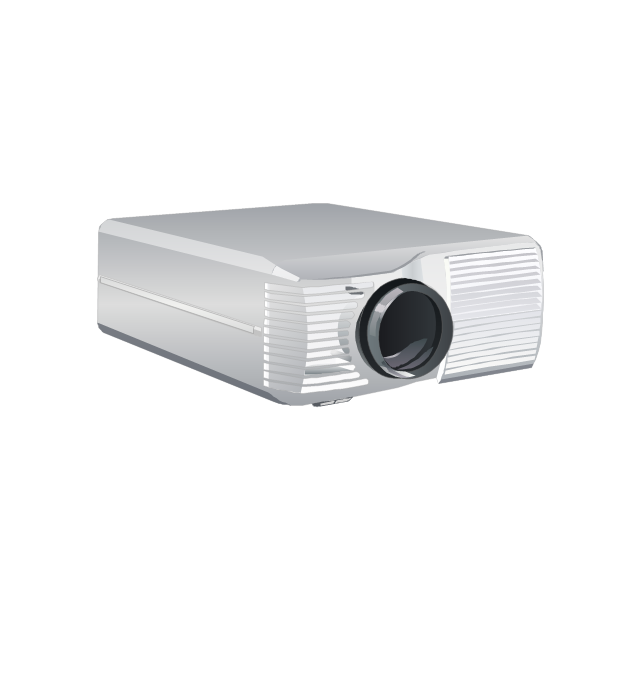
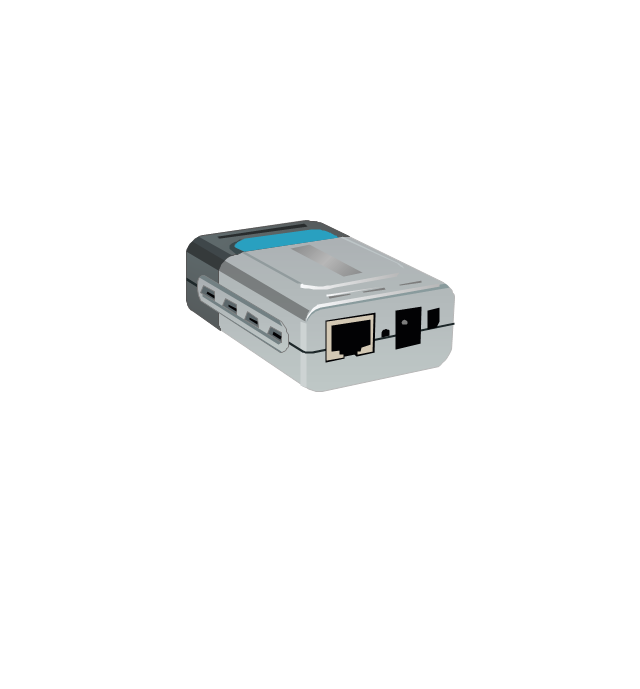
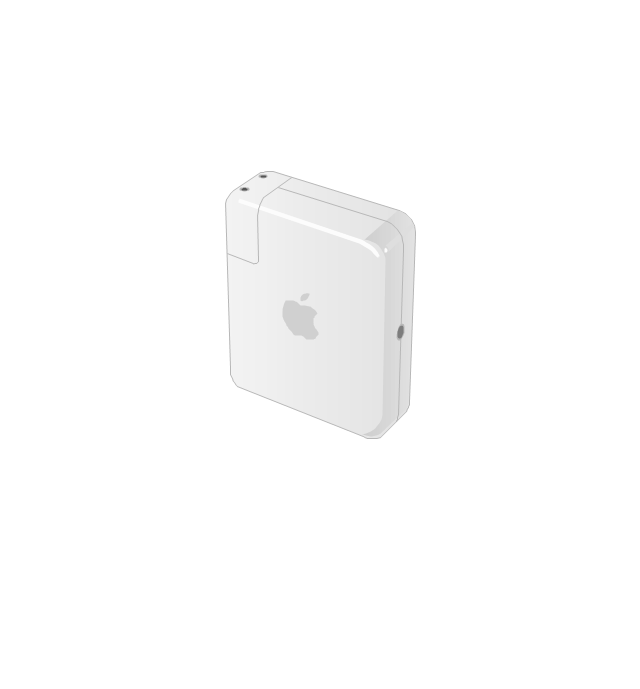
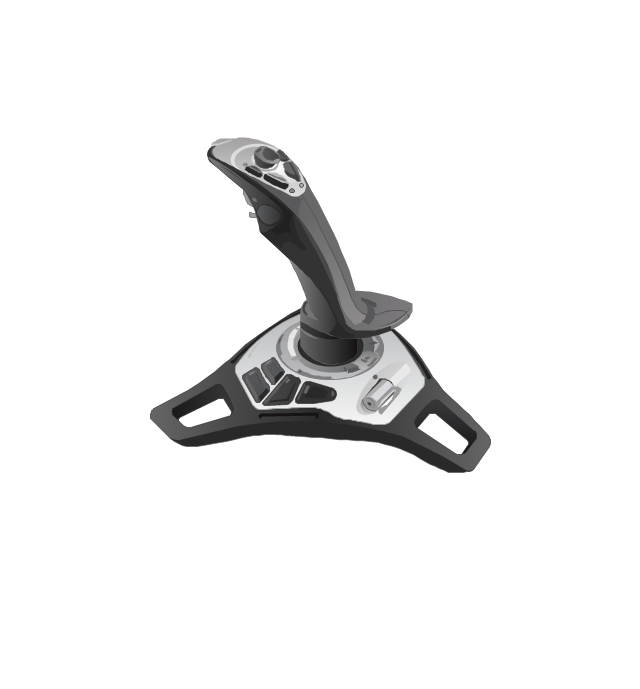
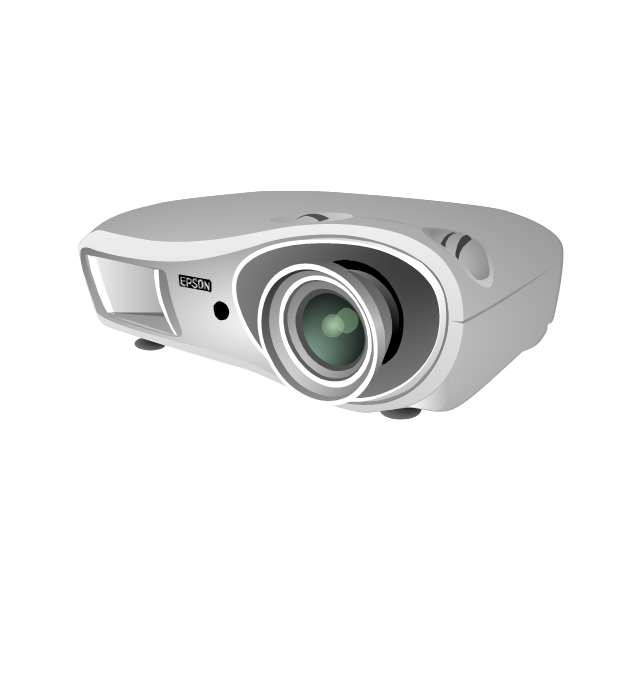
Organizing process is the process of creating the organizational structure of an enterprise. The organizing process consists of several stages. First, you need to divide the organization into departments, respectively to strategies, and then establish relationships of authority. After that, managing director delegates his rights and authorities.The vector stencils library "Computer peripheral devices" contains 18 clipart images of computer peripheral devices and equipment for drawing network diagrams.
"A peripheral is a device that is connected to a host computer, but not an integral part of it. It expands the host's capabilities but does not form part of the core computer architecture. It is often, but not always, partially or completely dependent on the host.
There are three different types of peripherals:
(1) Input, used to interact with, or send data to the computer (mouse, keyboards, etc.).
(2) Output, which provides output to the user from the computer (monitors, printers, etc.).
(3) Storage, which stores data processed by the computer (hard drives, flash drives, etc.)" [Peripheral. Wikipedia]
The clip art example "Computer peripheral devices - Vector stencils library" was created using the ConceptDraw PRO diagramming and vector drawing software extended with the Computer and Networks solution from the Computer and Networks area of ConceptDraw Solution Park.
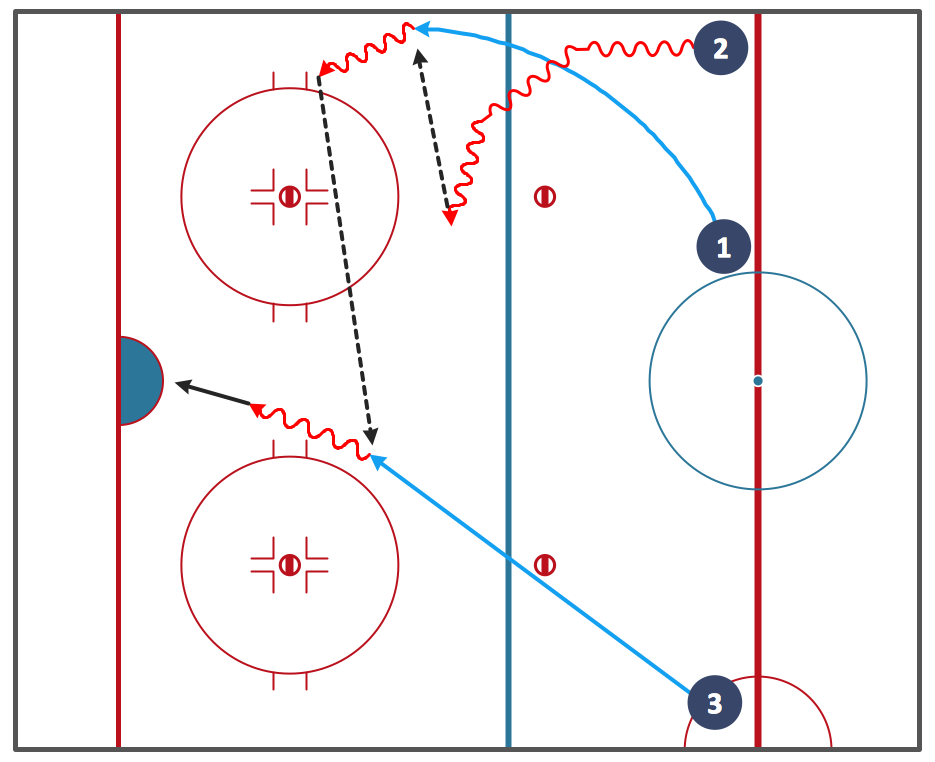
Ice Hockey Diagram — Entering Offensive Zone Drill
ConceptDraw DIAGRAM software extended with the Ice Hockey Solution allows you to draw professional looking ice hockey diagrams in minutes. You can easily customize existing samples or produce you own ones.WLAN
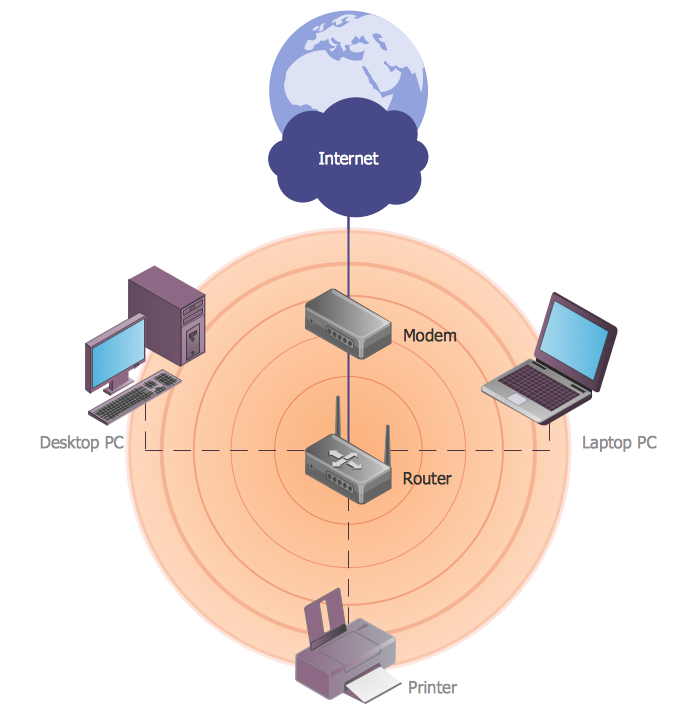
ConceptDraw DIAGRAM diagramming and vector drawing software extended with Wireless Networks Solution gives the ability to its users to create professional looking WLAN schemes and diagrams quick and easy.Geo Map - Africa
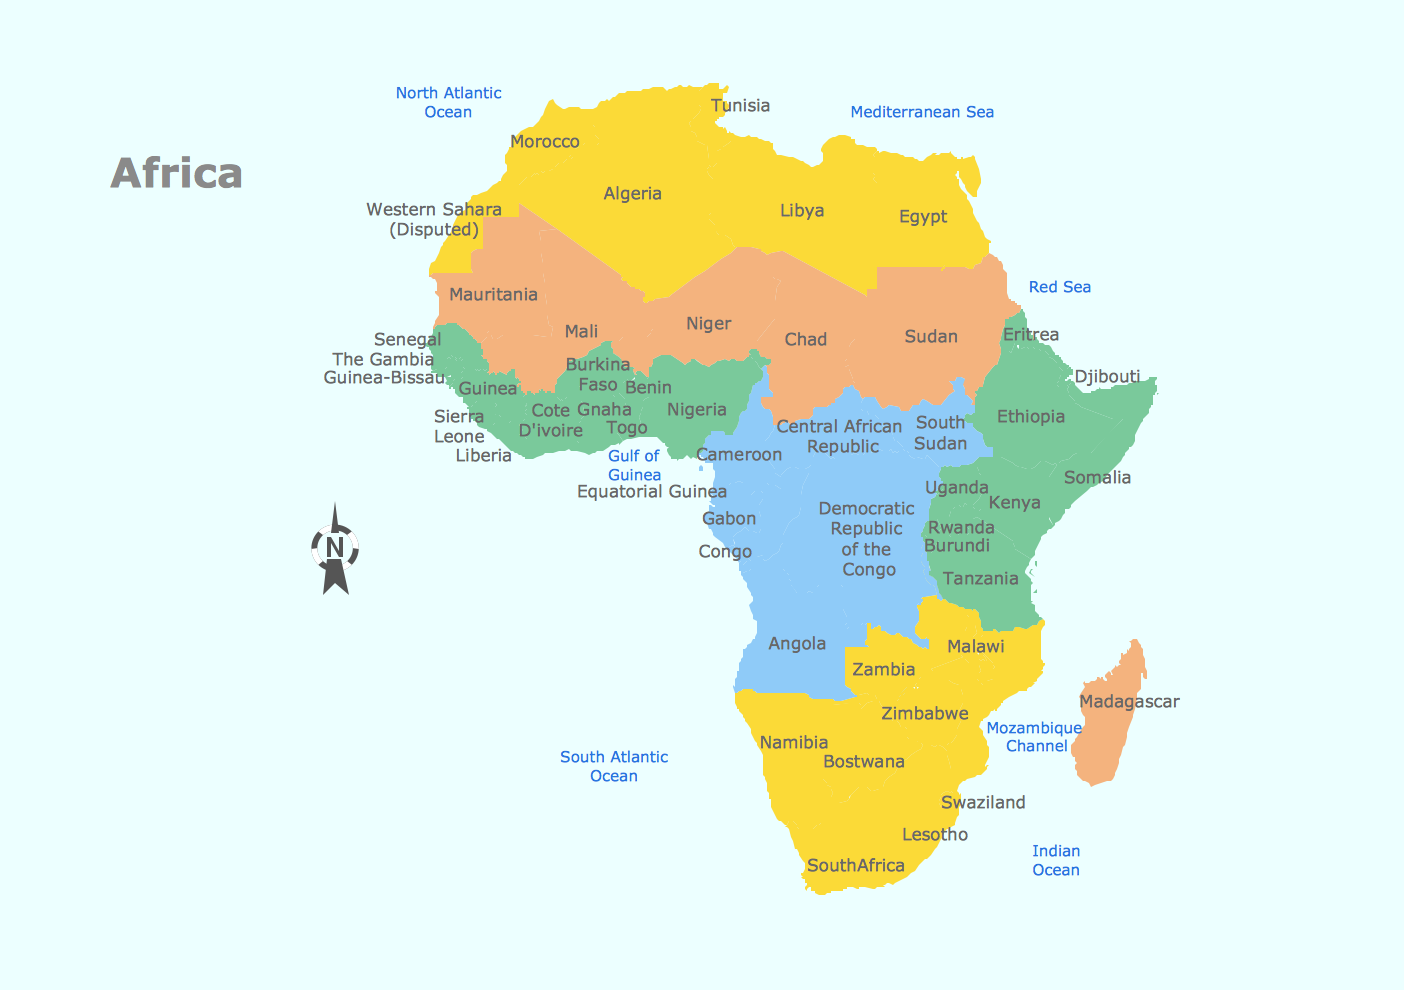
Africa has 54 fully recognized sovereign states, 9 territories and two de facto independent states with limited or no recognition. Vector design elements library Africa contains country map contours, geographical maps, cartograms and thematic maps for ConceptDraw DIAGRAM diagramming and vector drawing software. To help visualize the business and thematic information connected with geographic areas, locations or customs. All ConceptDraw DIAGRAM documents are vector graphic files and are available for reviewing, modifying, and converting to a variety of formats: image, HTML, PDF file, MS PowerPoint Presentation, Adobe Flash, MS Visio (.VDX,.VSDX).Flowchart Definition
Flowchart definition - A Flowchart is a diagram that graphically represents the structure of the system, the flow of steps in a process, algorithm, or the sequence of steps and decisions for execution a process or solution a problem. For depiction the steps there are used specific shapes and graphic symbols which are linked by lines and directional arrows. The main standard shapes are rectangle or box, rounded box, diamond, circle. A Flowchart is a convenient way to observe the follow the process from beginning to end, it lets improve the work of process, highlight the key elements and detach not essential or even excessive steps. The Flowcharts can represent different levels of detail: High-Level Flowchart, Detailed Flowchart, and Deployment or Matrix Flowchart. They are incredibly useful for programmers when developing the programs of any complexity and on any high level language. Create your own Flowcharts using the ConceptDraw DIAGRAM diagramming and vector drawing software and powerful tools of Flowcharts solution from "Diagrams" area.- Complete Network Topology | Star Network Topology | Network ...
- SYSML | Advantages And Disadvantages Of Completely Connected ...
- Fully Connected Network Topology Diagram | Bus Network ...
- Fully Connected Network Topology Diagram | Complete Network ...
- Completely Interconnected Network Topology
- Fully Connected Network Topology Diagram | Hybrid Network ...
- Merits And Demerits Of Daisy Chain Topology
- Daisy Chain Topology Advantage And Disadvantage
- Advantages And Disadvantages Of Hybrid Network Topology
- Fully Connected Network Topology Diagram | Complete Network ...
- Network Topologies | Overlay networks. Computer and Network ...
- Personal area (PAN) networks. Computer and Network Examples ...
- Daisy Chain Network Topology | Hybrid Network Topology | Hotel ...
- Tree Network Topology Diagram | How to Perform a Presentation on ...
- Daisy Chaining Advantage And Disadvantage
- EIGRP. Computer and Network Examples | Logical network topology ...
- Network Diagram Software. LAN Network Diagrams. Physical Office ...
- Interactive Voice Response Network Diagram | Pic Of Lan
- Create A Project In Network Topology Topics
- Hybrid Network Topology | How To Create CCTV Network Diagram ...
