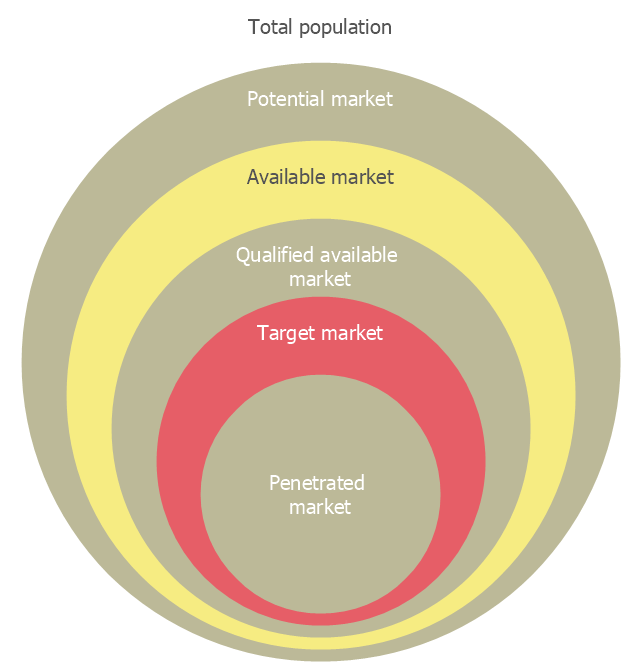
 Venn Diagrams
Venn Diagrams are actively used to illustrate simple set relationships in set theory and probability theory, logic and statistics, mathematics and computer science, linguistics, sociology, and marketing. Venn Diagrams are also often used to visually summarize the status and future viability of a project.
"A target market is a group of customers that the business has decided to aim its marketing efforts and ultimately its merchandise towards. A well-defined target market is the first element to a marketing strategy. The marketing mix variables of product, place (distribution), promotion and price are the four elements of a marketing mix strategy that determine the success of a product in the marketplace." [Target market. Wikipedia]
"An onion diagram is a kind of chart that shows the dependencies among parts of an organization or process. The chart displays items in concentric circles, where the items in each ring depend on the items in the smaller rings. ...
The Onion Diagram is able to show layers of a complete system in a few circles. Each of the circles is able to represent a component that is dependent upon the component on the inside of it shown by the circle inside of it. The main concept of the diagram is shown by the center circle of the diagram. This chart is used due to the fact that it has a clear visual representation that is easy to read, and it has a strong visual impact." [Onion diagram. Wikipedia]
This onion diagram (target diagram) example "Target market" was created using the ConceptDraw PRO diagramming and vector drawing software extended with the Target and Circular Diagrams solution from the Marketing area of ConceptDraw Solution Park.
www.conceptdraw.com/ solution-park/ marketing-target-and-circular-diagrams
 Rapid UML
Rapid UML solution extends ConceptDraw PRO software with templates, samples and libraries of vector stencils for quick drawing the UML diagrams using Rapid Draw technology.
 Circle-Spoke Diagrams
Examples of subject areas that are well suited to this approach are marketing, business, products promotion, process modeling, market, resource, time, and cost analysis. Circle-Spoke Diagrams are successfully used in presentations, conferences, management documents, magazines, reportages, reviews, reports, TV, and social media.
 Target and Circular Diagrams
This solution extends ConceptDraw PRO software with samples, templates and library of design elements for drawing the Target and Circular Diagrams.
- State Diagram Example - Online Store | UML Component Diagram ...
- UML Component Diagram Example - Online Shopping | UML Class ...
- UML Component Diagram Example - Online Shopping
- UML Collaboration Diagram Example Illustration | UML Component ...
- Data Flow Diagram (DFD) | UML Component Diagram | MindTweet ...
- Online shop - Concept map | UML interaction overview diagram ...
- Online Marketing Usecase Diagram
- UML Component Diagram Example - Online Shopping | UML ...
- Target Diagram | Target and Circular Diagrams | Target market ...
- UML Use Case Diagram Example Registration System | UML ...
- Component Diagram In Uml For Shop System
- UML Use Case Diagram Example Social Networking Sites Project ...
- Process Flowchart | Data Flow Diagrams (DFD) | Stakeholder ...
- Pyramid Diagram | Pyramid Chart Examples | Pyramid Diagram ...
- Diagram Of Marketing Information System
- Basic CCTV System Diagram . CCTV Network Diagram Example ...
- Data Flow Diagram (DFD) | UML Component Diagram | MindTweet ...
- Er Diagram For Small Marketing Company Database
- UML use case diagram - Trading system usage scenarios | UML use ...
- How to Create a Bar Chart | Process Flowchart | Components of ER ...
