Bar Chart Software
The best bar chart software ever is ConceptDraw. ConceptDraw bar chart software provides an interactive bar charting tool and complete set of predesigned bar chart objects.Waterfall Bar Chart
Waterfall chart shows the changing of the value from one state to another through the series of intermediate changes. The waterfall diagrams are widely used in the business. They are used to represent the set of figures and allow link the individual values to the whole.Bar Chart Examples
Complete set of bar chart examples is produced using ConceptDraw software. Surfing bar chart examples you can find an example that is the best for your case.Chart Maker for Presentations
Easy charting software comes with beautiful chart templates and examples. This makes it easy to create professional charts without prior experience.Basic Diagramming
Create flowcharts, organizational charts, bar charts, line graphs, and more with ConceptDraw PRO.
Percentage Pie Chart. Pie Chart Examples
This sample was created in ConceptDraw PRO diagramming and vector drawing software using the Pie Charts Solution from Graphs and Charts area of ConceptDraw Solution Park. This sample shows the Pie Chart of the approximate air composition. You can see the percentage of oxygen, nitrogen and other gases in the air visualized on this Pie Chart.Picture Graph
A Picture Graph is a popular and widely used type of a bar graph, which represents data in various categories using the pictures. ConceptDraw PRO extended with Picture Graphs solution from the Graphs and Charts area of ConceptDraw Solution Park is the best software for fast and simple drawing professional looking Picture Graphs.Growth-Share Matrix Software
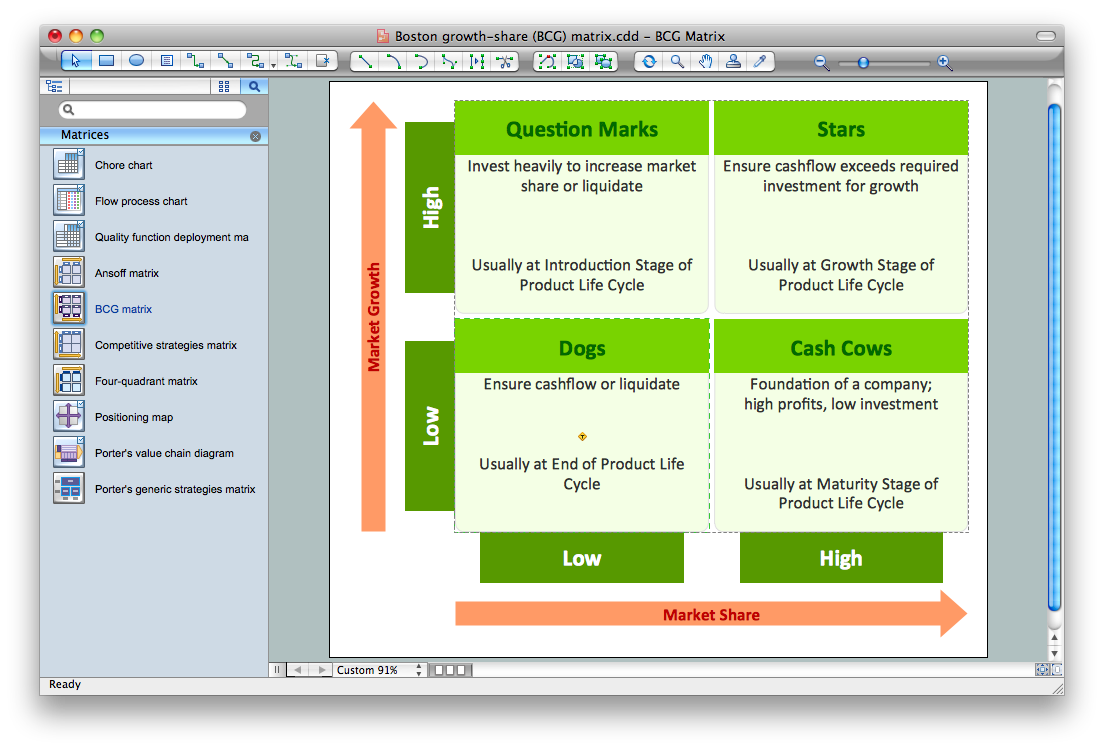
Growth-Share Matrix Software - ConceptDraw PRO is a powerful diagramming and vector drawing software for creating professional looking Growth–Share Matrices. For simple and quick creating the Growth–Share Matrix ConceptDraw PRO offers the Matrices Solution from the Marketing Area of ConceptDraw Solution Park. The Matrices Solution also provides a wide variety of templates and samples that will help you to create the Matrix diagrams of any difficulty.Bar Chart
ConceptDraw PRO extended with Bar Graphs solution from Graphs and Charts area of ConceptDraw Solution Park is ideal software for quick and simple drawing bar chart of any complexity graph.Sales Dashboards for Your Company
ConceptDraw PRO software extended with the Sales Dashboard solution allows you produce sales dashboards for your company easily. You can start from samples and templates delivered with the solution and then modify them to get a dashboard that suites your specific needs.
 Picture Graphs
Typically, a Picture Graph has very broad usage. They many times used successfully in marketing, management, and manufacturing. The Picture Graphs Solution extends the capabilities of ConceptDraw PRO v10 with templates, samples, and a library of professionally developed vector stencils for designing Picture Graphs.
Area Chart
ConceptDraw PRO diagramming and vector drawing software offers the Area Charts solution from the Graphs and Charts area of ConceptDraw Solution Park for quick and easy drawing the Area Chart of any complexity.
 Basic Area Charts
This solution extends the capabilities of ConceptDraw PRO v10.3.0 (or later) with templates, samples and a library of vector stencils for drawing Area Charts (area graphs) that visualize changes in values by filling in the area beneath the line connecting data points.
 Computer and Networks Area
The solutions from Computer and Networks Area of ConceptDraw Solution Park collect samples, templates and vector stencils libraries for drawing computer and network diagrams, schemes and technical drawings.
Competitor Analysis
Competitor analysis is a first and obligatory step in elaboration the proper corporate marketing strategy and creating sustainable competitive advantage. Use powerful opportunities of numerous solutions from ConceptDraw Solution Park for designing illustrative diagrams, charts, matrices which are necessary for effective competitor analysis.- Bar Chart Population Growth
- Column Chart Template | Network Security | Fishbone Diagram | Bar ...
- Bar Graph | Picture graphs - Vector stencils library | Sales Growth ...
- Sales Growth . Bar Graphs Example | Financial Comparison Chart ...
- Bar Graph Images
- What Is The Difrence Between The Componet Bar Chart And
- Bar Graphs | Sales Growth . Bar Graphs Example | How to Draw a ...
- Sales Growth . Bar Graphs Example | Finance - Vector stencils library ...
- Rainfall Bar Chart | Chart Maker for Presentations | Picture Graph ...
- Bar Graph On Food
- Bar Chart Examples | Geo Map - Asia | Telecommunication Network ...
- Percentage Pie Chart . Pie Chart Examples | Bar Diagrams for ...
- How to Create a Bar Chart | Sales Growth . Bar Graphs Example ...
- Picture graphs - Vector stencils library | Sales Growth . Bar Graphs ...
- Which Software Use For Line Chart Pie Chart Bar Chart On Computer
- Finance - Vector stencils library | Sales Growth . Bar Graphs Example ...
- Process Flowchart | Sales Growth . Bar Graphs Example | Venn ...
- Chart Maker for Presentations | Bar Chart Examples | Sales Growth ...
- Bar Graphs | Sales Growth . Bar Graphs Example | Financial ...


