Flowchart Programming Project. Flowchart Examples
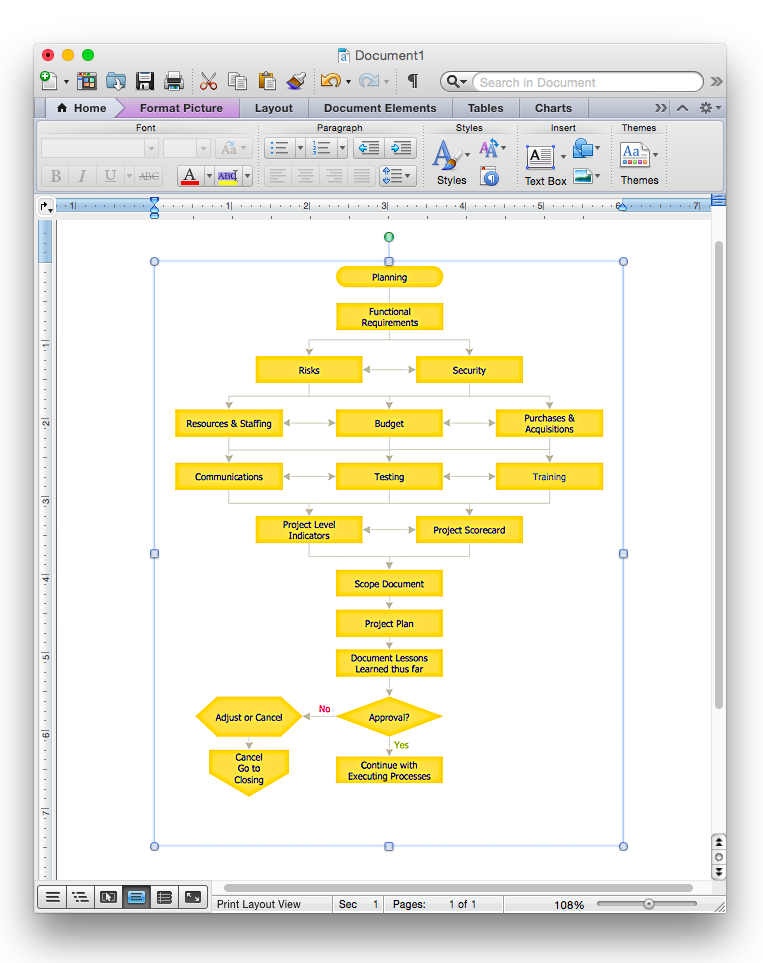
Create you own flow charts of process-driven software applications using the ConceptDraw DIAGRAM diagramming and vector drawing software extended with the Cross-Functional Flowcharts solution from the Business Processes area of ConceptDraw Solution Park. The programming project flow chart example shows the logical process of execution.Process Modelling using Event-driven Process chain
Event-Driven Process Chain Diagrams for improvement throughout an organisation. ConceptDraw DIAGRAM - business process mapping software that reduces the time needed to create a business process model and its excellent business process improvement tools.Interactive Voice Response Network Diagram
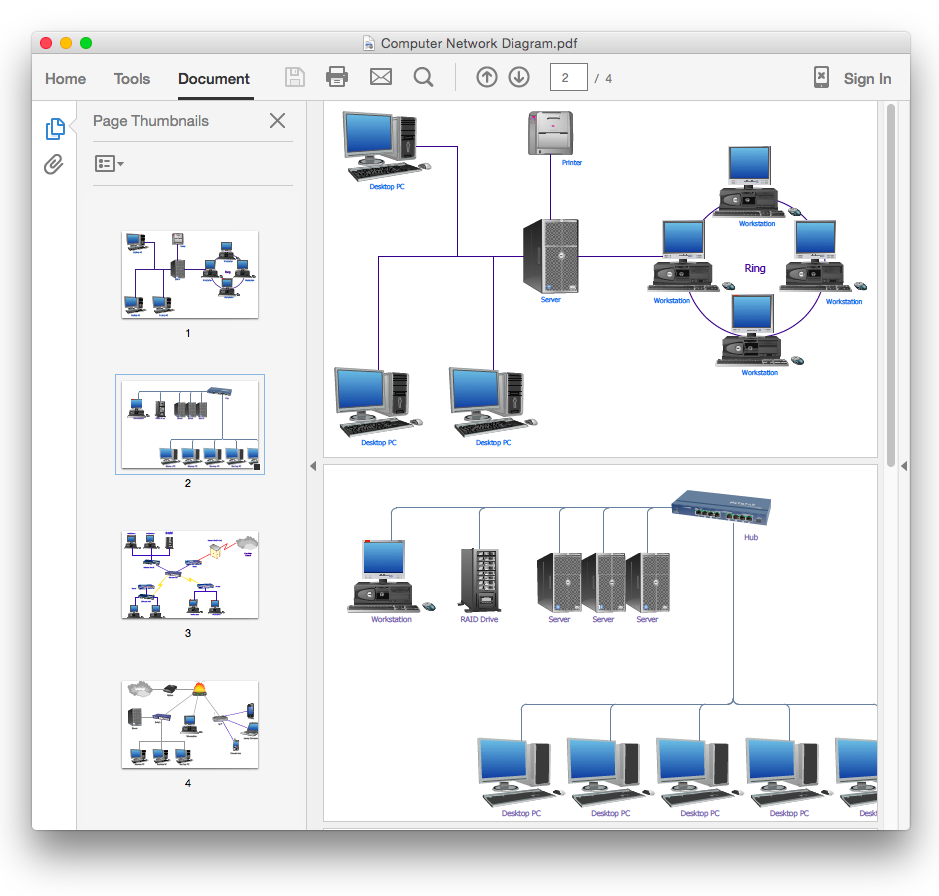
ConceptDraw solution Computer and Networks provides Interactive Voice Response samples, templates and library of 35 vector stencils for drawing the IVR network diagrams. Use ConceptDraw DIAGRAM diagramming and vector drawing software enhanced with solution Computer and Networks to visualize the logical and physical structure of IVR systems for inbound and outbound call centers and voice mail systems.Sample Project Flowchart. Flowchart Examples
This sample shows the Flowchart that displays the architecture of SQL Exception Translation. This sample was created in ConceptDraw DIAGRAM diagramming and vector drawing software using the Flowcharts solution from the Diagrams area of ConceptDraw Solution Park.Cash Flow Reports
The Cash Flow Reports solution extends the ConceptDraw PROJECT software with the abilities to generate three kinds of management reports in a form of spreadsheets: Cash Flow on Projects, Cash Flow on Resources, and Cash Flow on Tasks. Use them to monitor and to control the cash flow in projects and multiprojects, the project expenses by days, by resources, by tasks, and to analyze effectively the project progress and the compliance of project finances to allocated budget. Having a full content and ideal view, these reports are popular with the project planning and project management teams, project participants, team leaders, and project managers which have the need for demonstrating the steps of work on projects and reporting about project progress in printed reports or on a large screen. The projects examples included in this solution are illustrative and perfectly suit for comprehending all the solution's capabilities.
How To Create a Flow Chart in ConceptDraw
ConceptDraw DIAGRAM is a flowchart creating software. This software includes over 20 vector stencils in libraries. These objects allow you to create well-designed flowcharts. Put an initial object from library to a page and use RapidDraw technology clicking on direction arrows to add new objects to the flowchart. This way you can make flowchart quickly.Network Community Structure. Computer and Network Examples
Network community structure is a network which nodes can be easily grouped into the sets of nodes with dense internally connections. This example shows a network that displays the community structure with three groups of nodes with dense internal connections and sparser connections between the groups.Basic of Flowchart: Meaning and Symbols
Flowcharts are the best for visually representation the business processes and the flow of a custom-order process through various departments within an organization. ConceptDraw DIAGRAM diagramming and vector drawing software extended with Flowcharts solution offers the full set of predesigned basic flowchart symbols which are gathered at two libraries: Flowchart and Flowcharts Rapid Draw. Among them are: process, terminator, decision, data, document, display, manual loop, and many other specific symbols. The meaning for each symbol offered by ConceptDraw gives the presentation about their proposed use in professional Flowcharts for business and technical processes, software algorithms, well-developed structures of web sites, Workflow diagrams, Process flow diagram and correlation in developing on-line instructional projects or business process system. Use of ready flow chart symbols in diagrams is incredibly useful — you need simply drag desired from the libraries to your document and arrange them in required order. There are a few serious alternatives to Visio for Mac, one of them is ConceptDraw DIAGRAM. It is one of the main contender with the most similar features and capabilities.Critical Path Method in ConceptDraw PROJECT
The Critical Path Method (CPM) is an algorithm for scheduling a set of project activities. It is an important tool for effective project management. ConceptDraw PROJECT implements this method to provide the user with a wide set of project management tools.Interactive voice response (IVR) networks. Computer and Network Examples
Interactive Voice Response (IVR) is a system of the prerecorded voice messages that allows a computer to interact with humans. IVR performs the function of the routing calls within a call center, using the information entered by the customer on the phone keypad in the touchtone mode. This example was created in ConceptDraw DIAGRAM using the Computer and Networks Area of ConceptDraw Solution Park and show the Interactive Voice Response (IVR) network.Export from ConceptDraw DIAGRAM Document to PPT or PPTX (MS PowerPoint®) File
ConceptDraw DIAGRAM has extensive export capabilities which allow you to export your drawing toDiagramming software for Amazon Web Service diagrams, charts and schemes
Professional software: visualize general system architecture, AWS diagrams are part of architecturing tools provided with ConceptDraw Solution Park.Process Flowcharts
This solution extends ConceptDraw DIAGRAM software with templates, samples, and library of vector shapes for drawing the Process Flowcharts.
Flow Diagram Software
The diagram is a convenient way of representing complex information and data in a simple, visual and comprehensive form. There are used many types of diagrams, each of them has its own fields of application. Flow diagram is a diagram that illustrates the flow or set of dynamic relationships in a system, visually depicts the structure of the elements in a complex system and their interactions. The term Flow diagram is also synonym for a Flowchart. Flow Diagrams are the perfect way to visually represent the structural data. ConceptDraw DIAGRAM extended with Flowcharts solution from the Diagrams area is a professional flow diagram software. The basic set of vector stencils libraries offered by Flowcharts solution, variety of samples and templates developed by specialists, and also advanced RapidDraw technology open before ConceptDraw users wide opportunities in representing the flow processes, in drawing Flow Diagrams and Flowcharts of any type and complexity. Easy tools of exporting to different graphical formats give the possibility of further successful use the diagrams.Audit Flowcharts
Audit flowcharts solution extends ConceptDraw DIAGRAM software with templates, samples and library of vector stencils for drawing the audit and fiscal flow charts.
Cross-Functional Flowcharts
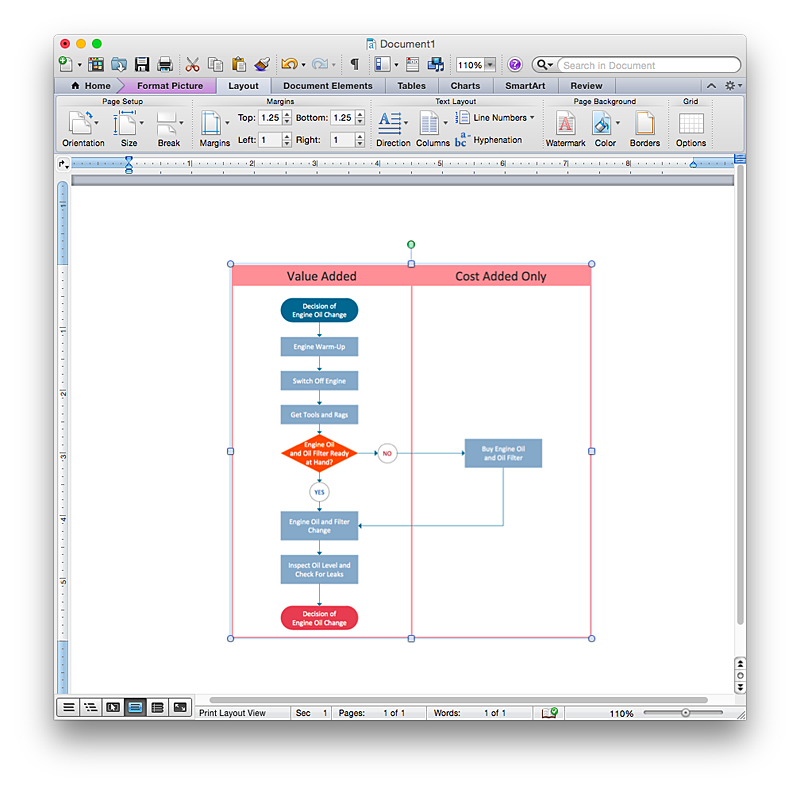
The Cross-Functional Flowcharts solution extends ConceptDraw DIAGRAM software with cross functional flowchart examples, samples, and libraries of cross functional flow chart vector design elements and CH-1 symbols for easy drawing professional-looking and illustrative Cross Functional Flowchart, Cross Functional Diagram, CH-1 Diagram, Process Flowchart, Deployment Flowchart, Opportunity Flowchart, Swimlane Process Mapping Diagram, or Visio Cross Functional Flowchart for planning and further analyzing, optimizing and improvement processes. The use of included pre-made cross functional flowchart template, opportunity flowchart template, and swimlane process map template, greatly easier designing your Cross-functional flowcharts.
Venn Diagram Examples for Problem SolvingComputer Science. Chomsky Hierarchy
A Venn diagram, sometimes referred to as a set diagram, is a diagramming style used to show all the possible logical relations between a finite amount of sets. In mathematical terms, a set is a collection of distinct objects gathered together into a group, which can then itself be termed as a single object. Venn diagrams represent these objects on a page as circles or ellipses, and their placement in relation to each other describes the relationships between them.
The Venn diagram example below visualizes the class of language inclusions described by the Chomsky hierarchy.
Sales Flowcharts
The Sales Flowcharts solution lets you create and display sales process maps, sales process workflows, sales steps, the sales process, and anything else involving sales process management.
Flowchart Components
The ConceptDraw Flowchart component includes a set of samples and templates. This geathered as flowchart maker toolbox which focused on drawing flowcharts of any industry standards.- Process Flowchart | Flowchart To Show How A Computer Works
- Process Flowchart | Computer Project For Drawing On Chart
- Basic Flowchart Symbols and Meaning | Process Flowchart ...
- Flowchart Programming Project . Flowchart Examples | Basic ...
- How To Plan and Implement Projects Faster | Process Flowchart
- Computer Hardware - Reseller Business Plan | Process Flowchart ...
- Process Flowchart | Flow Chart Of Computer Assembly Building
- How to Generate ConceptDraw PROJECT Standard Reports on PC ...
- Computer Network Diagrams | Audit Flowcharts | How To Add a ...