HelpDesk
How to Create a Concept Map in ConceptDraw PRO
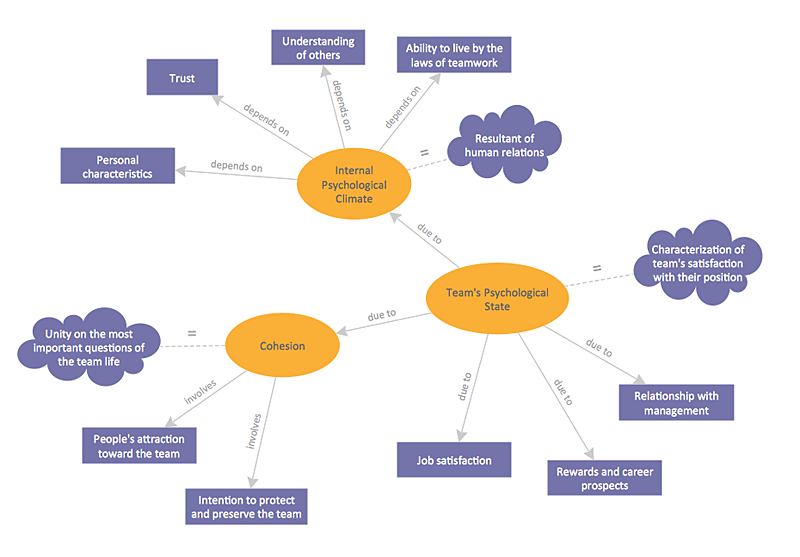
Graphical technique of knowledge representation in a form of structured networks of concepts (ideas) is called concept mapping. Concept network consists of shapes that represent concepts and connectors representing relationships between concepts. The difference between mind maps and concept maps is that a mind map has only one object depicting a main idea , while a concept map may have several. Concept mapping is used to structure ideas, to communicate complex system of knowledge, to help learning process, etc. ConceptDraw PRO allows you to draw concept maps using the Concept Map solution.What is SWOT Analysis in Marketing
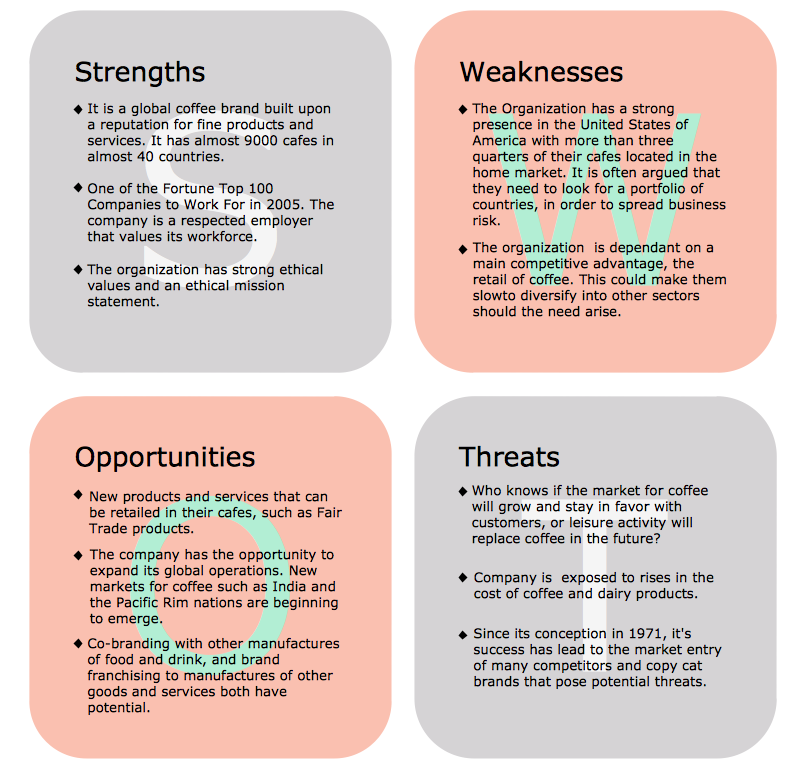
What is SWOT analysis in marketing? SWOT analysis gives for analysts, marketing specialists and other professionals the perfect ability to identify the positives and negatives in an organization, as well as in the external environment. The SWOT and TOWS methods were developed for business and industry, they involve the specifying of a project's objective and identifying internal and external causes for accomplishing the project goals. A full awareness about the situation within and around your business can help effectively with both strategic planning and decision-making. ConceptDraw PRO and ConceptDraw MINDMAP software allow professionals to make the situation analysis, to develop strategies and plans for achievement defined objectives, to suppose the possible scenarios of further activity, to see the whole situation at a glance, to create well-designed SWOT and TOWS matrices in minutes. The SWOT and TOWS Matrix Diagrams solution from ConceptDraw Solution Park includes the SWOT matrix samples and templates that allow users quickly create their own SWOT and TOWS diagrams.Business Tools Perceptual Mapping
This sample shows the Perceptual map. It was created in ConceptDraw PRO diagramming and vector drawing software using the Matrices Solution from the Marketing area of ConceptDraw Solution Park. Perception Mapping helps organizations measure and transform all aspects of their business, people and culture. Perception Mapping allows to represent the complex relationships graphically, helps identify potential problems of the organization and make the best decisions.
 SWOT Analysis
SWOT and TOWS Matrix Diagrams solution extends ConceptDraw PRO and ConceptDraw MINDMAP software with features, templates, samples and libraries of vector stencils for drawing SWOT and TOWS analysis matrices and mind maps.
Process Flowchart
The main reason of using Process Flowchart or PFD is to show relations between major parts of the system. Process Flowcharts are used in process engineering and chemical industry where there is a requirement of depicting relationships between major components only and not include minor parts. Process Flowcharts for single unit or multiple units differ in their structure and implementation. ConceptDraw PRO is Professional business process mapping software for making Process flowcharts, Process flow diagram, Workflow diagram, flowcharts and technical illustrations for business documents and also comprehensive visio for mac application. Easier define and document basic work and data flows, financial, production and quality management processes to increase efficiency of your business with ConcepDraw PRO. Business process mapping software with Flowchart Maker ConceptDraw PRO includes extensive drawing tools, rich examples and templates, process flowchart symbols and shape libraries, smart connectors that allow you create the flowcharts of complex processes, process flow diagrams, procedures and information exchange. Process Flowchart Solution is project management workflow tools which is part ConceptDraw Project marketing project management software. Drawing charts, diagrams, and network layouts has long been the monopoly of Microsoft Visio, making Mac users to struggle when needing such visio alternative like visio for mac, it requires only to view features, make a minor edit to, or print a diagram or chart. Thankfully to MS Visio alternative like ConceptDraw PRO software, this is cross-platform charting and business process management tool, now visio alternative for making sort of visio diagram is not a problem anymore however many people still name it business process visio tools.
SWOT Analysis
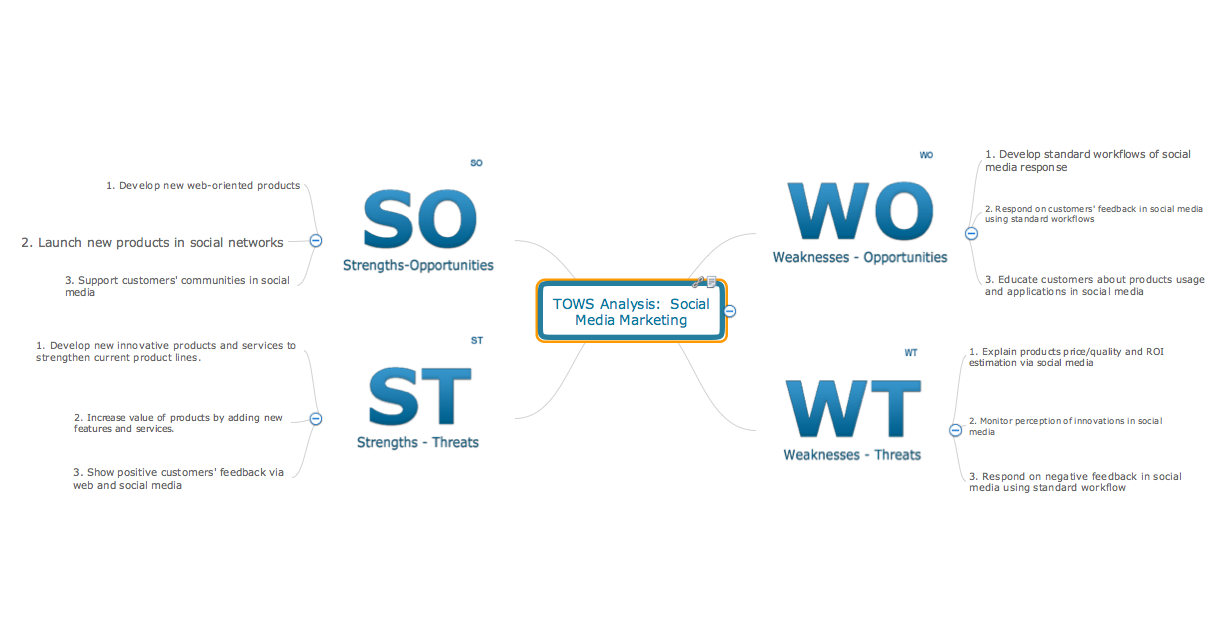
Using mind mapping to define Strengths, Weaknesses/Limitations, Opportunities, and Threats is a natural fit. SWOT mind maps quickly capture your ideas, and allow you to add and subtract easily, ensuring you don’t overlook any important items.
 ConceptDraw Solution Park
ConceptDraw Solution Park collects graphic extensions, examples and learning materials
Flowchart Marketing Process. Flowchart Examples
This sample shows the Flowchart that displays the layout and work flow of the cloud marketing platform. This diagram has a style of the marketing brochure. This style displays the central product that is related to the other issues. Using the ready-to-use predesigned objects, samples and templates from the Flowcharts Solution for ConceptDraw PRO you can create your own professional looking Flowchart Diagrams quick and easy.Basic Flowchart Examples
ConceptDraw PRO is a business flowchart software includes the wide flowchart examples package.
 SWOT and TOWS Matrix Diagrams
SWOT and TOWS Matrix Diagrams solution extends ConceptDraw PRO and ConceptDraw MINDMAP software with features, templates, samples and libraries of vector stencils for drawing SWOT and TOWS analysis matrices and mind maps.
SWOT matrix template
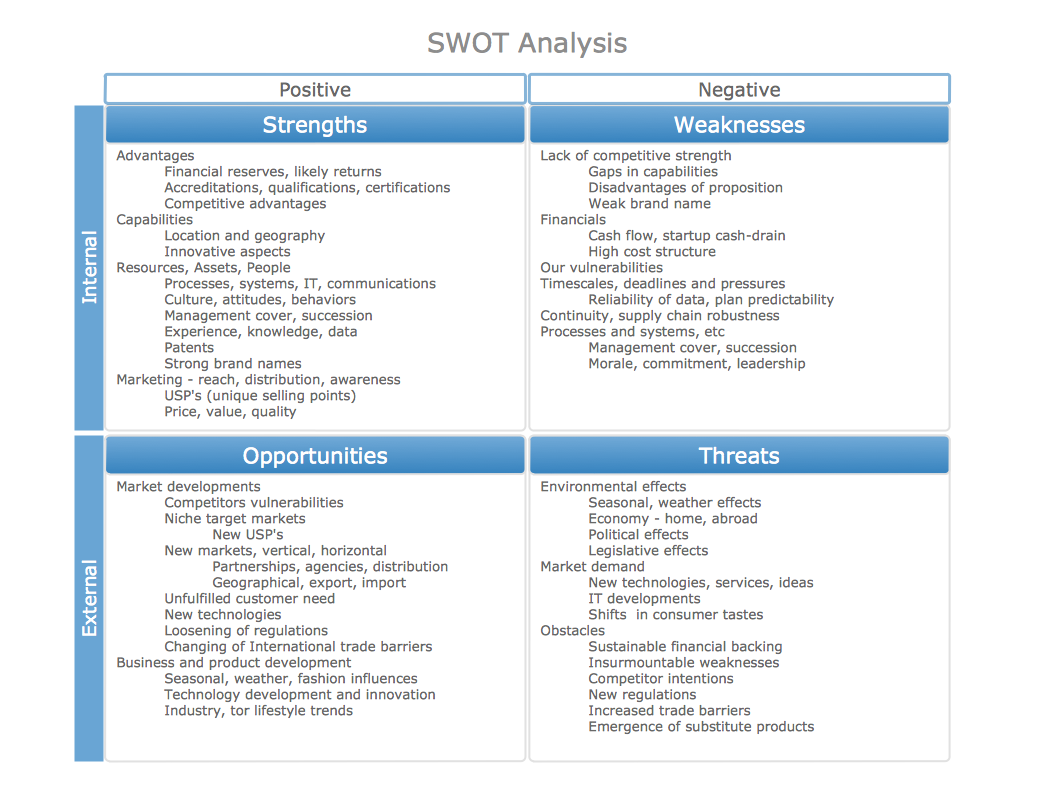
SWOT matrix templates is part of SWOT Analysis solution from ConceptDraw Solution Park.SWOT Analysis matrix templates and samples
SWOT Analysis solution extends ConceptDraw MINDMAP v7 and ConceptDraw PRO v9 products with easy-to-use SWOT Analysis tools.HelpDesk
How to Draw a Line Chart Quickly
A common line chart is a graphical representation of the functional relationship between two series of data. A line chart that is created by connecting a series of data points together with a straight line is the most basic type of a line chart. A line chart can be used for depicting data that changes continuously over time. It is extensively utilized in statistics, marketing and financial business. ConceptDraw Line Graph solution provides the possibility to make 2D line charts quickly and effortlessly.Flowchart of Products. Flowchart Examples
This sample shows the Flowchart of the Sustainment and Disposal. A Flowchart is a graphically representation of the process that step-by-step lead to the solution the problem. The geometric figures on the Flowchart represent the steps of the process and are connected with arrows that show the sequence of the actions. The Flowcharts are widely used in engineering, architecture, science, analytics, government, politics, business, marketing, manufacturing, administration, etc.- Internet marketing - Concept map | Concept Maps | What Is a ...
- Internet marketing - Concept map | What Is a Concept Map | Leaky ...
- Internet marketing - Concept map | Positioning Map | Mind Maps for ...
- What is SWOT Analysis in Marketing | Concept Maps | Collaboration ...
- What Is a Concept Map | Concept Maps | How to Create a Concept ...
- Internet marketing - Concept map
- What Is a Concept Map | Flowchart Marketing Process. Flowchart ...
- Internet marketing - Concept map | How to Draw a Circular Arrows ...
- SWOT Analysis | What is SWOT Analysis in Marketing | Business ...
- Marketing - Vector stencils library | Internet marketing - Concept map ...
- Internet marketing - Concept map | What Is a Concept Map ...
- Internet marketing - Concept map | What Is a Concept Map ...
- SWOT Analysis | What is SWOT Analysis in Marketing | How to ...
- Concept Of Marketing With Diagram
- Mind Maps for Business - SWOT Analysis | What is SWOT Analysis ...
- Internet marketing - Concept map | Marketing - Vector stencils library ...
- Mind Maps for Business - SWOT Analysis | Marketing | Business ...
- Concept Maps For Sales Marketer
- Concept Maps | eLearning for Skype | Diagrammatical ...
- Concept Maps


