Landscape Architecture with ConceptDraw DIAGRAM
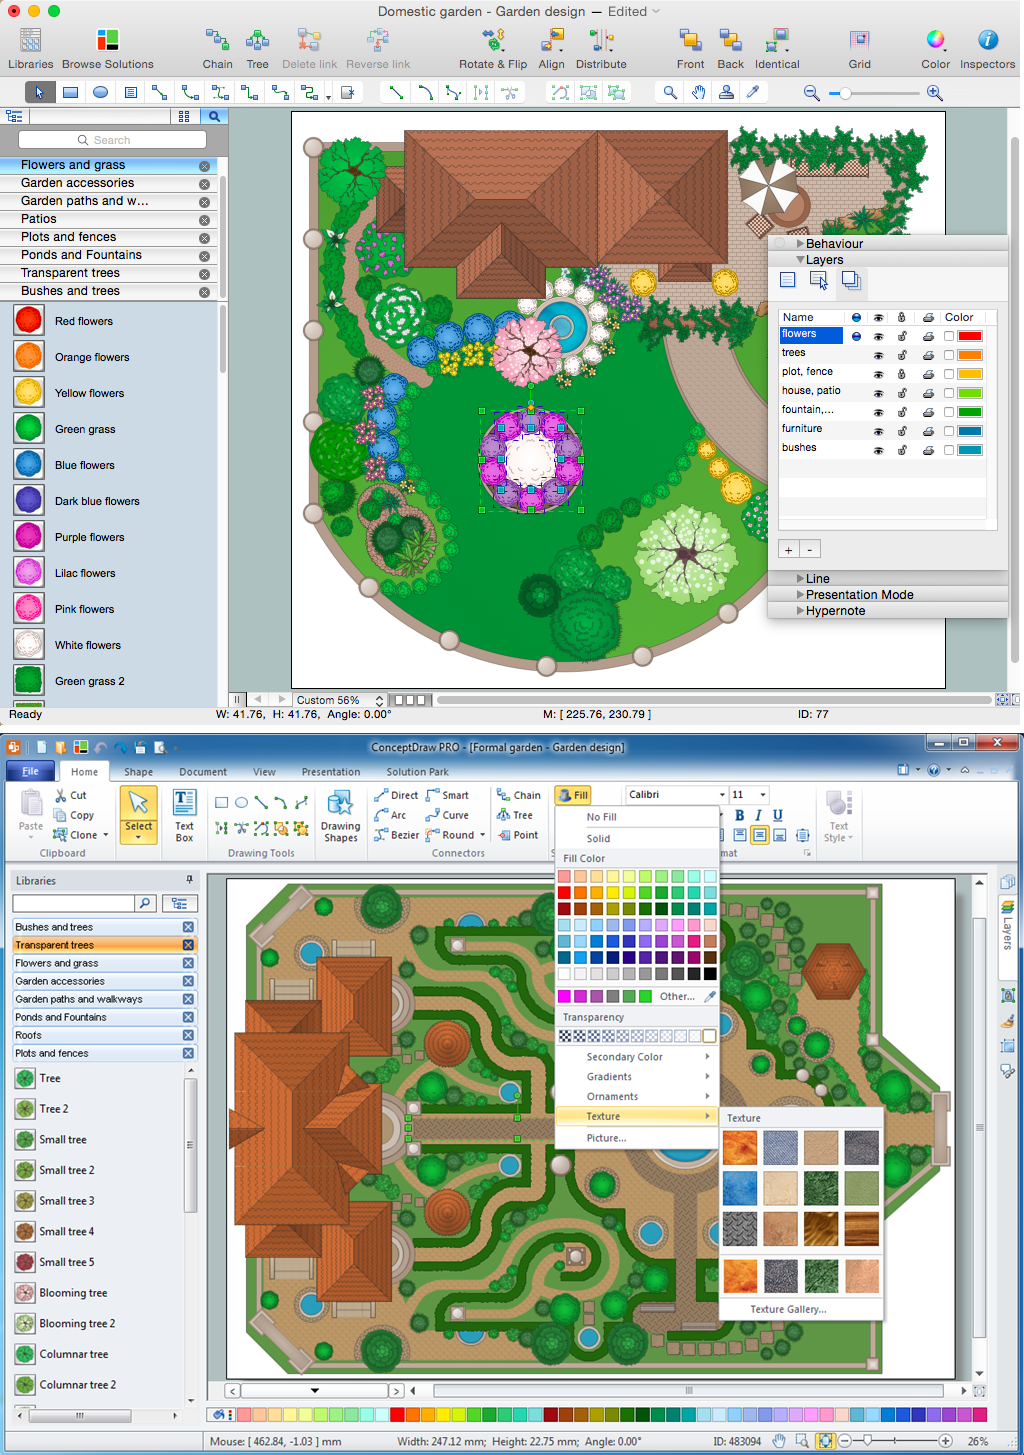
The landscape architecture includes landscape design, planning, and realization, as well as management of resources and buildings. The smaller scale landscape projects are well known as landscape design and garden design. The landscape design documentation is created independently from the project's scale and includes sketches, general plan and working documentation. On this stage the ConceptDraw DIAGRAM software extended with Landscape & Garden solution is irreplaceable assistant for you. The landscape designs created using ConceptDraw DIAGRAM are effectively used by landscape architects and engineers, also by landscape managers who maintain parks, gardens, natural landscapes like woodlands or nature reserves, and artificial landscapes. The Landscape and Garden solution contains 14 libraries with a lot of vector graphics objects of trees, flowers, bushes, fountains, ponds, furniture, roofs, patios, fences, garden accessories, entertainment, roads, junctions, etc., that are suitable for any gardener to simply design a wonderful garden.HelpDesk
Downloading the Old Versions of ConceptDraw Products
These are the last updates that were released for the previous versions of ConceptDraw products.
 Biology
Biology solution extends ConceptDraw DIAGRAM software with samples, templates and libraries containing biological vector symbols, to help you create scientific and educational designs in the field of biology.
Product Overview
ConceptDraw PROJECT is a vigorous tool for managing single or multiple projects. It lets you determine all essential elements involved into project, control schedules, resources and finances, and monitor projects' progress in most effective yet simple manner.Data Flow Diagram Symbols. DFD Library
Data Flow Diagrams graphically represent the information transfers and process steps of a system. They visually depict how data are processed by a system in terms of inputs and outputs, how occurs the input in a system, how the data flow through an information system and where they are stored, and how occurs output from the system. DFDs give the overview of the system and models the processes aspects, they are maintained with other methods of structured systems analysis. The main goal of DFDs is achievement of understanding between developers and users. For their construction are used two notations - Gane-Sarson and Yourdon, each of them uses its own set of symbols. Data Flow Diagrams solution from Software Development area extends the ConceptDraw DIAGRAM software with templates, samples, and predesigned libraries of data flow diagram symbols for both notations, allowing you easy design the process-oriented and data-oriented models, draw the Data Flow Diagrams, Data Flowcharts, Data Process Diagrams, Information Flow Diagrams, Structured Analysis Diagrams, etc.Program Evaluation and Review Technique (PERT) with ConceptDraw DIAGRAM
Program Evaluation and Review Technique (abbr. PERT) is a method developed by Ministry of Defense of the USA in 1958 for the project of creation the missile system Polaris. PERT diagram is one of the tools for project management that lets greatly simplify the planning and scheduling of large and complex projects. PERT diagram provides evaluation of project run-time and labor forces, it helps to analyze the time necessary for execution each of project tasks and the whole project, and to calculate the project critical path. PERT chart depicts the set of tasks connected each other in order of their execution and is constructed according to one of definite rules - AOA (activity on arrow) or AON (activity on node). It doesn't give you ready concrete decisions, but helps to find them. Design easy the PERT diagrams in ConceptDraw DIAGRAM software enhanced with Seven Management and Planning Tools solution from Management area of ConceptDraw Solution Park. You have a possibility to build the PERT chart of any type, but AON variant is easier for building and perception.What Constitutes a Project?
Separated into categories of Basic, Intermediate, and Advanced categories, the new instructional videos about ConceptDraw PROJECT cover a huge breadth of topics, explaining how to use project management software. Users new to ConceptDraw PROJECT will find the Basic lessons an essential platform for familiarizing themselves with the programs′s functions and found it simple project management software. This video lesson is the first in Basic lessons series tells about affordable simple project management software, it may be used as an intro for what is project management using simple project management sample. ConceptDraw PROJECT is excellent portfolio project management software, this lessons explains how to use project management software for small business in case of multi project environment.


