HelpDesk
Replace Your Current Diagramming Tool
 ConceptDraw Solution Park
ConceptDraw Solution Park collects graphic extensions, examples and learning materials
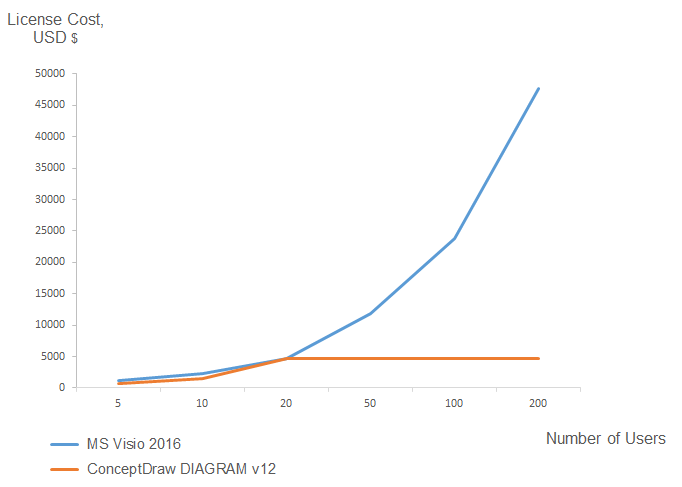
In searching of alternative to MS Visio for MAC and PC with ConceptDraw DIAGRAM

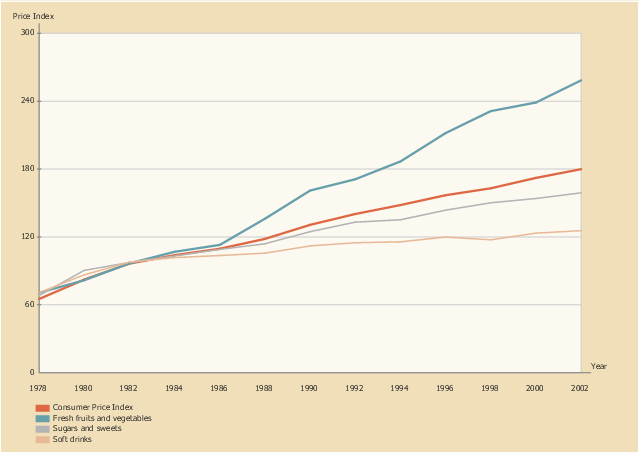
This line graph sample shows the relative price changes for fresh fruits and vegetables, sugars and sweets, and soft drinks, using the period 1982–84 as the baseline (index = 100), 1978–2002. It was designed on the base of line chart from the website of the U.S. National Center for Chronic Disease Prevention and Health Promotion.
"The number of overweight and obese youth has increased in recent decades, yet few data assess how the lives of children have changed during the “obesity epidemic.” ...
Eating as a primary activity declined, suggesting a shift toward snacking or eating as a secondary activity. Statistically significant trends exist for carbohydrate intake, especially for chips/ crackers/ popcorn/ pretzels (intake tripled from the mid-1970s to the mid-1990s) and soft drinks (intake doubled during the same period). Price and income data suggest possible economic reasons for these changes. The percentage of disposable income spent on food has declined continuously, and almost all of the decline has been represented by food consumed at home, yet today’s disposable income buys more calories than it has in the past. Relative prices have encouraged shifts across food types. From a baseline of 100 during 1982–84, the price index for fresh fruit and vegetables increased to 258 by 2002 (far exceeding general inflation), whereas the price index for soft drinks increased only to 126 by 2002 (below general inflation)." [cdc.gov/ pcd/ issues/ 2005/ apr/ 04_ 0039.htm]
The line chart example "Relative price changes for fresh fruits and vegetables, sugars, sweets, soft drinks" was created using the ConceptDraw PRO diagramming and vector drawing software extended with the Line Graphs solution from the Graphs and Charts area of ConceptDraw Solution Park.
Line chart
ConceptDraw Solution Park
ConceptDraw Solution Park collects graphic extensions, examples and learning materials
ConceptDraw DIAGRAM Compatibility with MS Visio

- Changes in price indices - Double bar chart | Bar Chart Examples ...
- Changes in price indices - Double bar chart | How to Create a Bar ...
- Price Comparison Website Flowchart
- Selling Price Of A Product Block Diagram
- Relative price changes for fresh fruits and vegetables, sugars ...
- Competitor Analysis | Six Markets Model Chart | Relative price ...
- Conceptdraw .com: Mind Map Software, Drawing Tools | Project ...
- Pictures of Vegetables | Relative price changes for fresh fruits and ...
- Fruit Art | Pictures of Vegetables | Relative price changes for fresh ...
- ConceptDraw Solution Park | Network Icon | How to Create a Bar ...
- Workflow Diagram | ConceptDraw Solution Park | Making Price ...
- ConceptDraw Solution Park | Food Court | F&B | High Food Prices ...
- Fast food restaurant menu prices | How to Design a Fast-Food ...
- Fast food restaurant menu prices | Restaurant Floor Plans Samples ...
- Design elements - Fast food | Fast food restaurant menu prices ...
- ConceptDraw PRO Compatibility with MS Visio | In searching of ...
- Export Pricing Strategies Diagram
- What Makes ConceptDraw PRO the Best Alternative to MS Visio ...
- Price Tag Png Images