 Bubble Diagrams
Bubble diagrams have enjoyed great success in software engineering, architecture, economics, medicine, landscape design, scientific and educational process, for ideas organization during brainstorming, for making business illustrations, presentations, planning, design, and strategy development. They are popular because of their simplicity and their powerful visual communication attributes.
Bubble diagrams in Landscape Design with ConceptDraw DIAGRAM
Bubble Diagrams are the charts with a bubble presentation of data with obligatory consideration of bubble's sizes. They are analogs of Mind Maps and find their application at many fields, and even in landscape design. At this case the bubbles are applied to illustrate the arrangement of different areas of future landscape design, such as lawns, flowerbeds, playgrounds, pools, recreation areas, etc. Bubble Diagram helps to see instantly the whole project, it is easy for design and quite informative, in most cases it reflects all needed information. Often Bubble Diagram is used as a draft for the future landscape project, on the first stage of its design, and in case of approval of chosen design concept is created advanced detailed landscape plan with specification of plants and used materials. Creation of Bubble Diagrams for landscape in ConceptDraw DIAGRAM software is an easy task thanks to the Bubble Diagrams solution from "Diagrams" area. You can use the ready scanned location plan as the base or create it easy using the special ConceptDraw libraries and templates.HelpDesk
How to Draw a Block Diagram
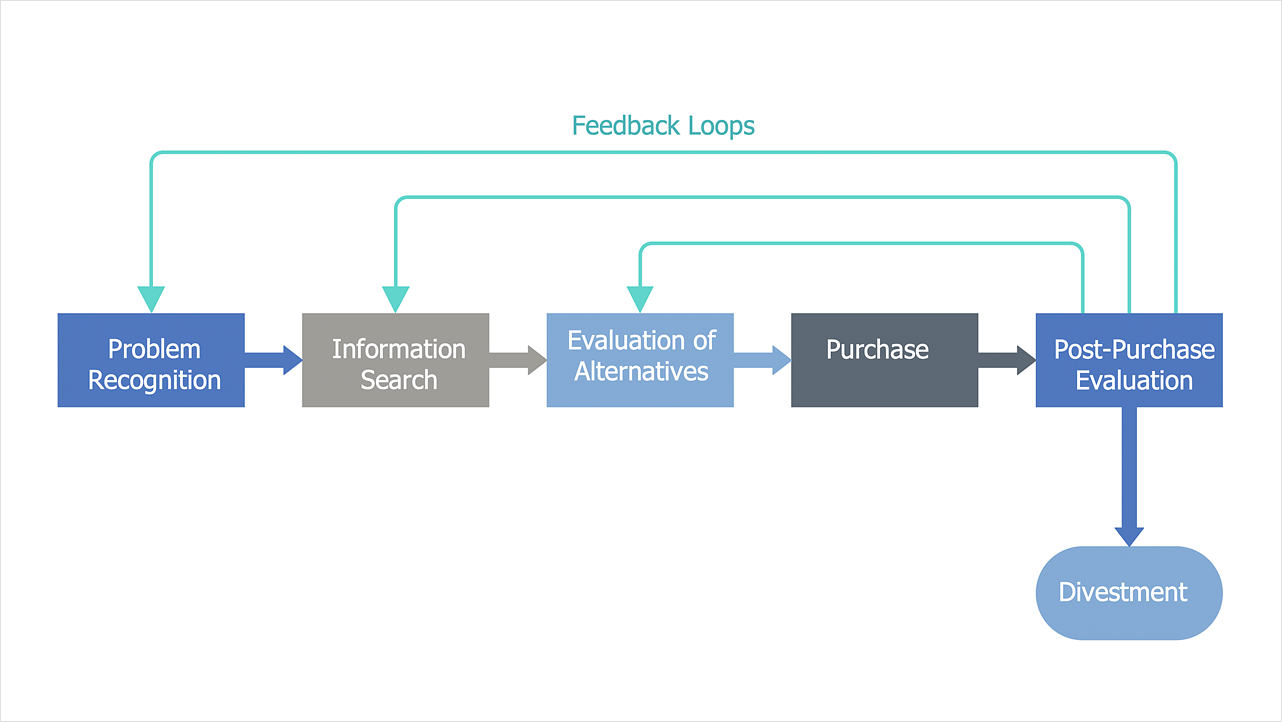
Block diagram is a simple chart that use blocks to show some elements or activities, and connectors that show the relationship between neighboring blocks. They are commonly simple, giving an overview of a process without necessarily going into the specifics of implementation. Block diagrams are commonly used to depict a general description of a system and its activity. A most known sample of a block diagram is a flow chart, used in many types of business as a common method of representing repeated processes. Easy and a simple creation, a number of objects and connectors make the block diagram a many-sided tool for various industries. The ability to make block diagrams is delivered by the ConceptDraw Block Diagrams solution.HelpDesk
How to Create an Entity-Relationship Diagram
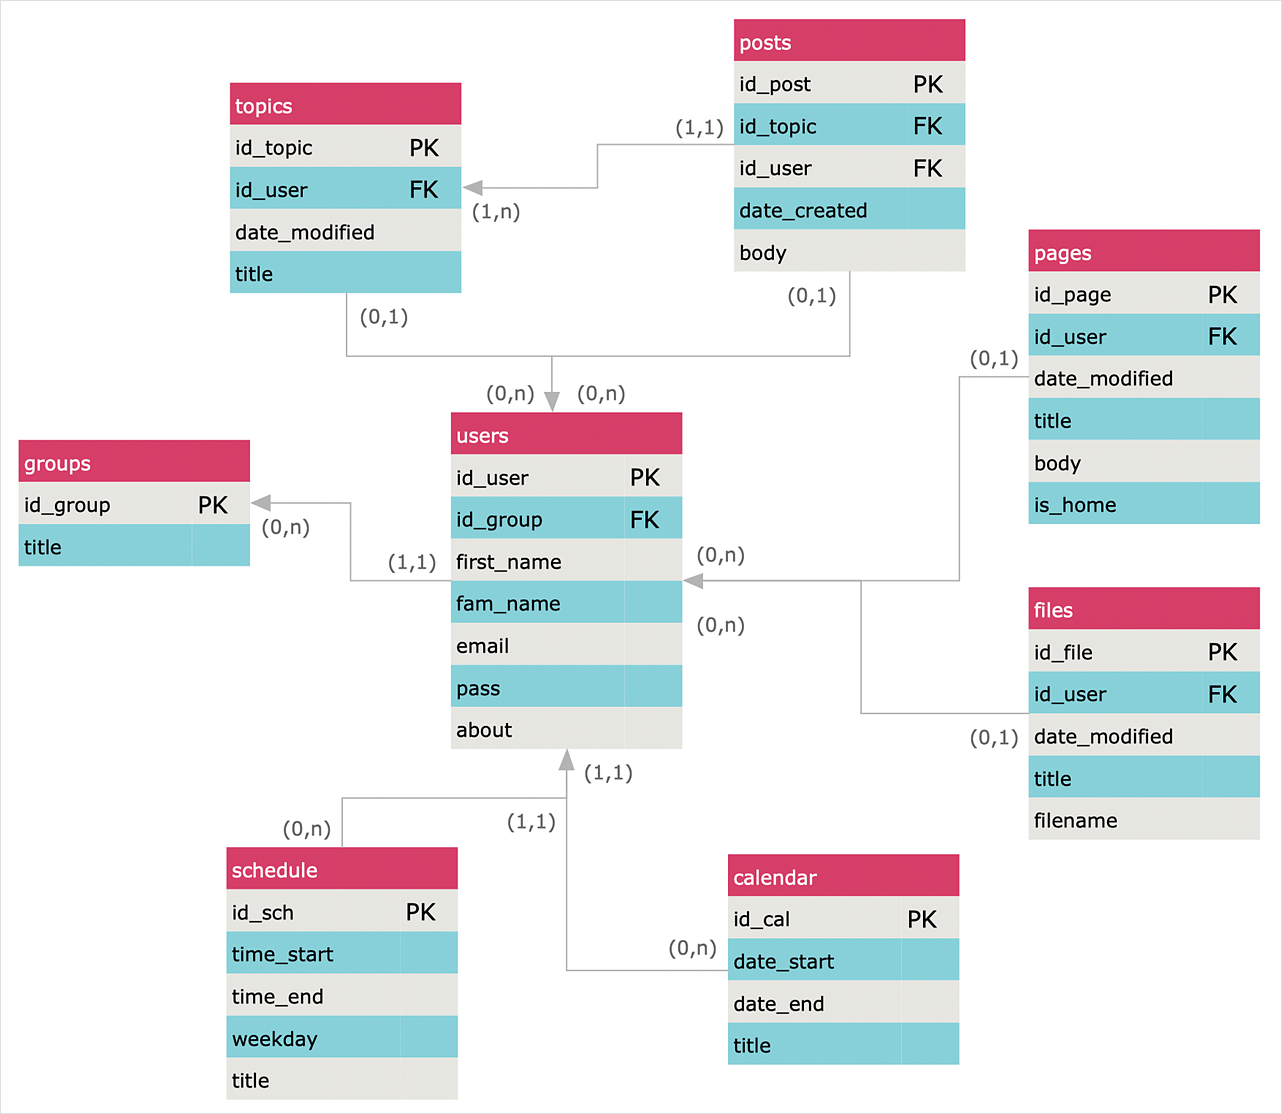
ERD (entity relationship diagram) is used to show the logical structure of databases. It represents the interrelationships between components of a database (entities). Entity relationship diagrams are widely used in software engineering. Using ERD software engineers can control every aspect of database development. ER diagram can be used as the guide for testing and communicating before the release of a software product. ERD displays data as entities that are connected with connections that show the relationships between entities. There are some ERD notations used by databases developers for representing the relationships between the data objects. ConceptDraw DIAGRAM and its ERD solution allow you to build ERD diagram of any notation.- Bubble Diagrams | How to Add a Bubble Diagram to a PowerPoint ...
- Bubble diagrams in Landscape Design with ConceptDraw PRO ...
- How to Add a Bubble Diagram to a MS Word Document Using ...
- Bubble diagrams with ConceptDraw PRO | Data Flow Diagrams ...
- What Is Bubble Diagram And Conceptual Map
- Conceptual Architecture Diagram
- Bubble diagrams with ConceptDraw PRO | How to Add a Bubble ...
- Bubble diagrams with ConceptDraw PRO | Spa Floor Plan | Gym ...
- Conceptual diagram
- Process Flowchart | Bubble diagrams in Landscape Design with ...
- Concept Diagram Architecture
- How To use Landscape Design Software | Building Drawing ...
- Landscape & Garden | Bubble diagrams in Landscape Design with ...
- Conceptual Diagram Of Drawing Tool
- ConceptDraw PRO ER Diagram Tool | How to Add a Bubble ...
- Bubble Diagram And Zoning Of Hospital
- UML Use Case Diagram Example Social Networking Sites Project ...
- Conceptual Architecture Diagram Sample
- How To Draw Entity Relationship Diagrams On Ms Word


