 Computer and Networks Area
The solutions from Computer and Networks Area of ConceptDraw Solution Park collect samples, templates and vector stencils libraries for drawing computer and network diagrams, schemes and technical drawings.
 Cisco Network Diagrams
Cisco Network Diagrams solution extends ConceptDraw PRO software with samples, templates and libraries of vector stencils for drawing the Cisco computer network diagrams.
 Network Layout Floor Plans
Network Layout Floor Plans solution extends ConceptDraw PRO software functionality with powerful tools for quick and efficient documentation the network equipment and displaying its location on the professionally designed Network Layout Floor Plans. Never before creation of Network Layout Floor Plans, Network Communication Plans, Network Topologies Plans and Network Topology Maps was not so easy, convenient and fast as with predesigned templates, samples, examples and comprehensive set of vector design elements included to the Network Layout Floor Plans solution. All listed types of plans will be a good support for the future correct cabling and installation of network equipment.
This wheel diagram sample was created on the base of figure illustrating the webpage "Chapter 3: Current State of the Ecosystem" of the website of the National Broadband Plan of US Federal Communications Comission (FCC). "The broadband ecosystem includes applications and content: e-mail, search, news, maps, sales and marketing applications used by businesses, user-generated video and hundreds of thousands of more specialized uses. Ultimately, the value of broadband is realized when it delivers useful applications and content to end-users.
Applications run on devices that attach to the network and allow users to communicate: computers, smartphones, set-top boxes, e-book readers, sensors, private branch exchanges (PBX), local area network routers, modems and an ever-growing list of other devices. New devices mean new opportunities for applications and content.
Finally, broadband networks can take multiple forms: wired or wireless, fixed or mobile, terrestrial or satellite. Different types of networks have different capabilities, benefits and costs.
The value of being connected to the network increases as more people and businesses choose to adopt broadband and use applications and devices that the network supports. Several factors contribute to their decisions. These include whether they can afford a connection, whether they are comfortable with digital technology and whether they believe broadband is useful.
Networks, devices and applications drive each other in a virtuous cycle. If networks are fast, reliable and widely available, companies produce more powerful, more capable devices to connect to those networks. These devices, in turn, encourage innovators and entrepreneurs to develop exciting applications and content. These new applications draw interest among end-users, bring new users online and increase use among those who already subscribe to broadband services. This growth in the broadband ecosystem reinforces the cycle, encouraging service providers to boost the speed, functionality and reach of their networks."
[broadband.gov/ plan/ 3-current-state-of-the-ecosystem/ ]
The circle pie chart example "Forces shaping the broadband ecosystem in the US" was created using the ConceptDraw PRO diagramming and vector drawing software extended with the Target and Circular Diagrams solution from the Marketing area of ConceptDraw Solution Park.
www.conceptdraw.com/ solution-park/ marketing-target-and-circular-diagrams
Wheel diagram

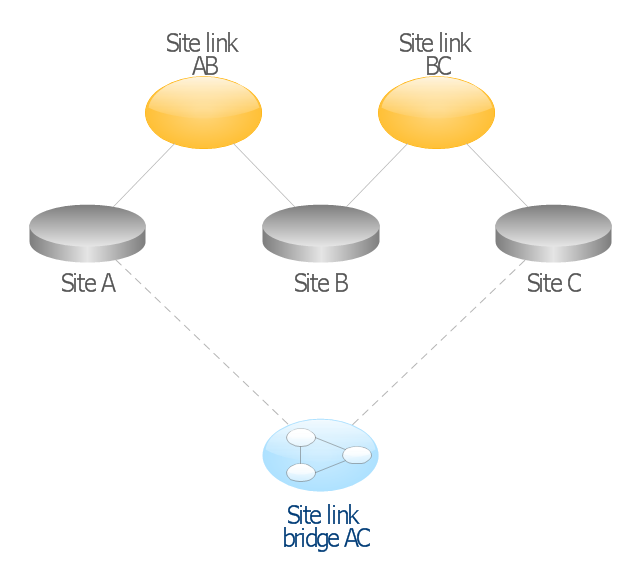
This AD diagram example was redesigned from the picture "Site links" from the book "Active Directory for Dummies".
"Site links represent the Active Directory replication paths between sites.
These paths are manually defined so that the designer has control over which network links the replication traffic occurs on. These site links also control how clients are directed to domain controllers when there’s no DC in the client’s local site. Each site link has the following attributes:
(1) Connected sites: A site link is defined by the sites to which it connects. A site link can connect two or more sites together.
(2) Network transport: Site links support replication communication over IP-based RPCs or with the Simple Mail Transport Protocol (SMTP). You normally want to use RPC whenever possible, but you can use SMTP when the sites you’re linking don’t support RPC.
(3) Cost: Each site link has a cost associated with it. Costs are used to assign preferences to links that determine which link should be followed when multiple link paths are available between sites. The cost represents what it “costs” to use this site link relative to the other site links and affects replication traffic as well as how users are assigned a domain controller. Links with lower cost values have preference over links with higher cost values. Cost values range from 1–32,767; the default being 100.
(4) Frequency: The frequency value defines how often a replication occurs
when using this site link (the replication latency). You can configure the time between replications from a minimum of 15 minutes to a maximum of 10,080 minutes (one week). The default frequency is 180 minutes.
(5) Schedule: The schedule dictates when this link is active and available for replication between the sites. The schedule can also control which days of the week the link is available. Normally, the schedule is set so that the link is available 24 hours a day, but you can set up different schedules on a per-day-of-the-week basis.
By creating a site link, you enable two or more sites to be connected and to share the same site link attributes (transport, cost, frequency, and schedule). By default, site links create transitive connectivity between sites.
If you create a site link between sites A and B and another site link between
sites B and C, an automatic connection (known as a site link bridge) is created between sites A and C..." [Steve Clines and Marcia Loughry, Active Directory® For Dummies®, 2nd Edition. 2008]
The Active Directory diagram example "Site links" was created using the ConceptDraw PRO diagramming and vector drawing software extended with the Active Directory Diagrams solution from the Computer and Networks area of ConceptDraw Solution Park.
Active Directory network diagram
 Vehicular Networking
Network engineering is an extensive area with wide range of applications. Depending to the field of application, network engineers design and realize small networks or complex networks, which cover wide territories. In latter case will be ideal recourse to specialized drawing software, such as ConceptDraw PRO.
 Active Directory Diagrams
Active Directory Diagrams solution extends ConceptDraw PRO software with samples, templates and libraries of vector stencils for drawing the AD diagrams to visualize the detail structures of the Microsoft Windows networks.
- Home Area Network Example
- Local Area Network Diagram
- Complete Network Topology | Fully Connected Network Topology ...
- Wide area network (WAN) topology. Computer and Network ...
- Network Diagram Software Home Area Network | Local area ...
- Network Diagram Examples | Physical LAN and WAN diagram ...
- Network Diagram Software Home Area Network | Diagram of a Basic ...
- Network Layout | Ethernet local area network layout floor plan ...
- Wireless Network Topology | Hotel Network Topology Diagram ...
- Wireless router network diagram | Network Diagram Software Home ...
- Metropolitan area networks (MAN). Computer and Network Examples
- Ethernet local area network layout floor plan | Network Layout Floor ...
- GPS operation diagram | Local area network ( LAN ) diargam ...
- How To use Switches in Network Diagram | Cisco Network Objects ...
- Wireless access point - Network diagram | Roaming wireless local ...
- Using Both Wired and Wireless Connections | Wireless access point ...
- Wireless Networks | Wireless Network Diagram Examples | Hotel ...
- Logical network diagram | Diagramming tool - Amazon Web ...
- Physical LAN and WAN diagram template | Computer network ...
- Wireless Network WLAN | Wireless mesh network diagram | Hotel ...