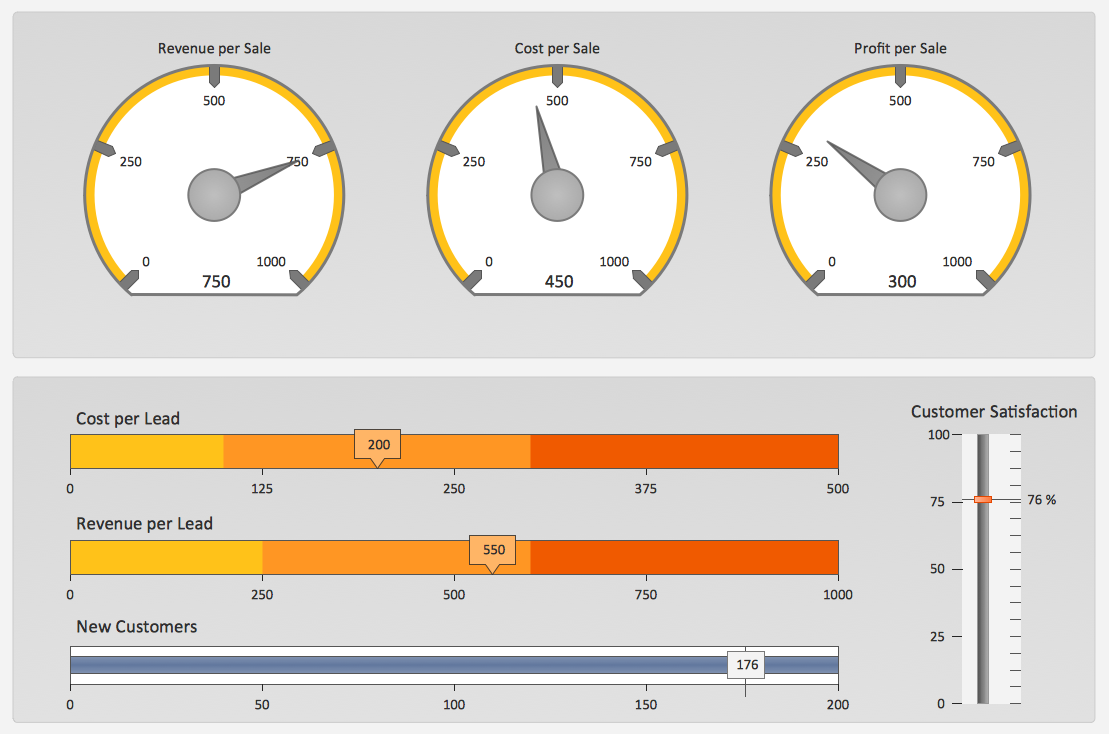
Performance Indicators
ConceptDraw PRO diagramming and vector drawing software offers the useful tools of the Sales Dashboard solution from the Marketing area for easy creating professional looking live dashboards which allow to track the business sales activity and progress thanks to representing the Key Performance Indicators (KPIs) on them.Sales Dashboard Solutions can help your sales team keep an eye on performance
ConceptDraw Sales Dashboard Solution is a simple and effective way of visualizing sales data and get clear picture of your sales process to see how your business can improve.TQM Diagram — Professional Total Quality Management
The Total Quality Management Diagram solution helps you and your organization visualize business and industrial processes. Create Total Quality Management diagrams for business process with ConceptDraw software.What is a Quality Management
Successful quality management implemented in a company of any size is a critical component of a company organization.Quality Improvement
Constant improvement of key performance indicators that are related to quality is a step in the right direction for a company interested in market growth.Quality visualization in your company
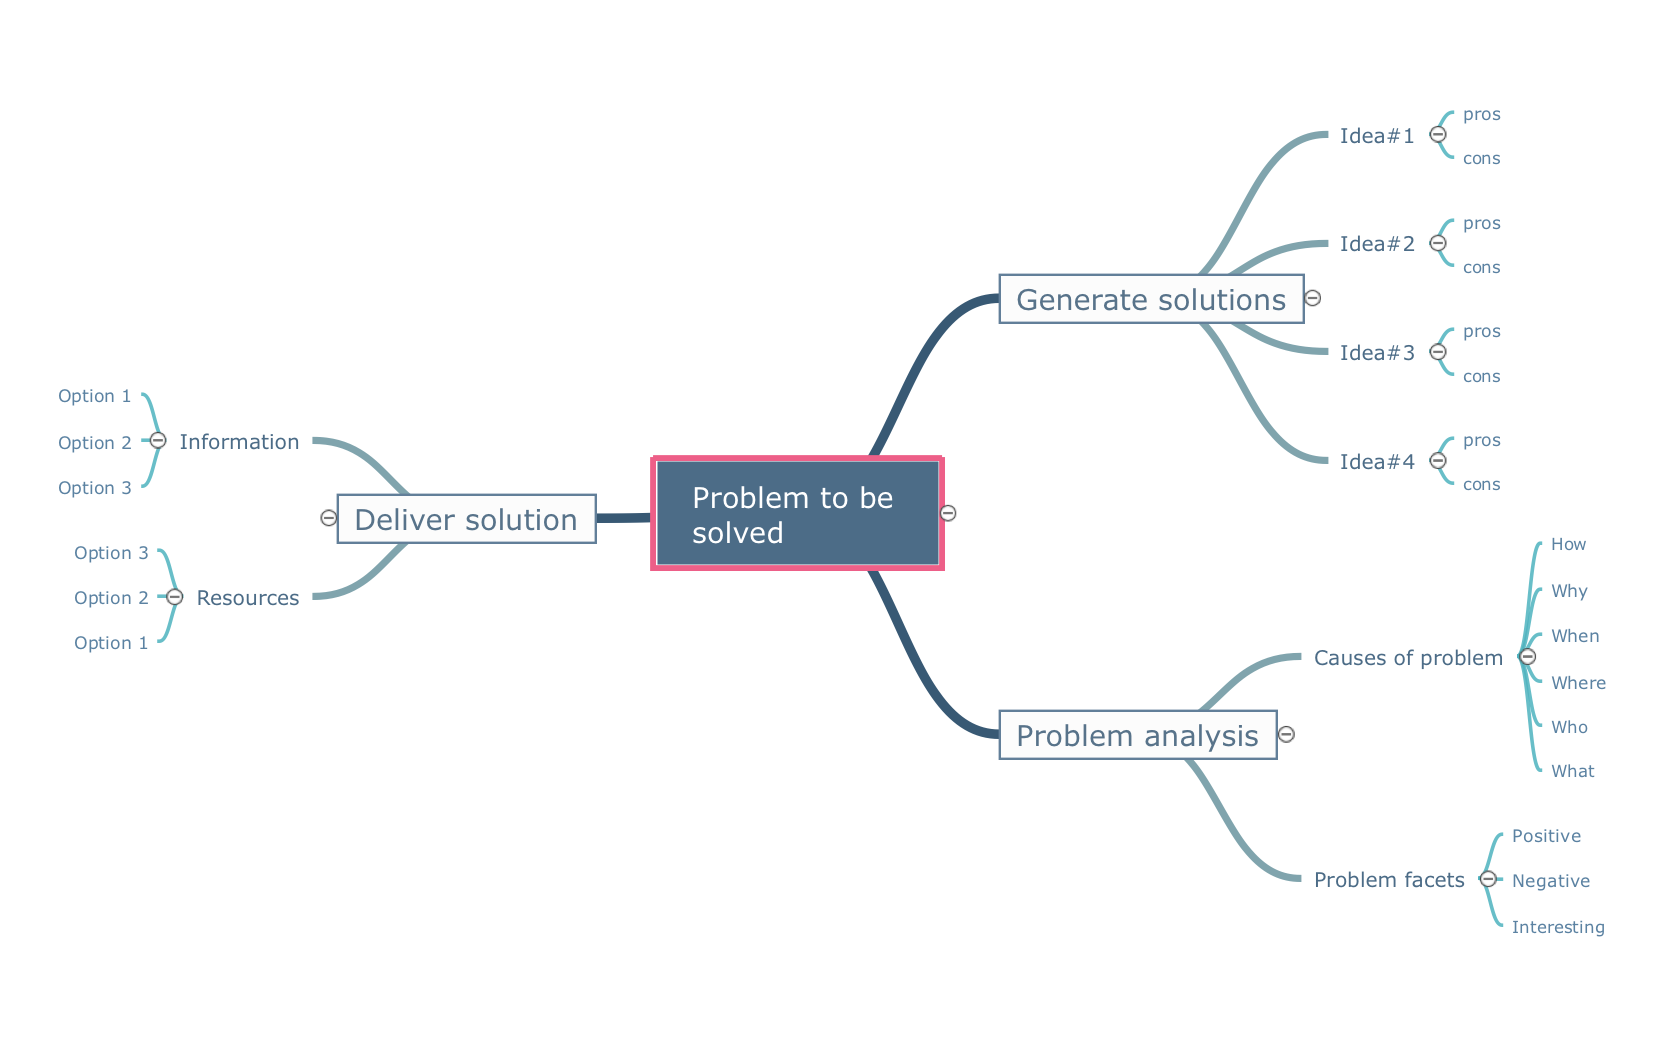
Using ConceptDraw quality mind maps is a perfect addition to quality visualization in your company.Total Quality Management Value
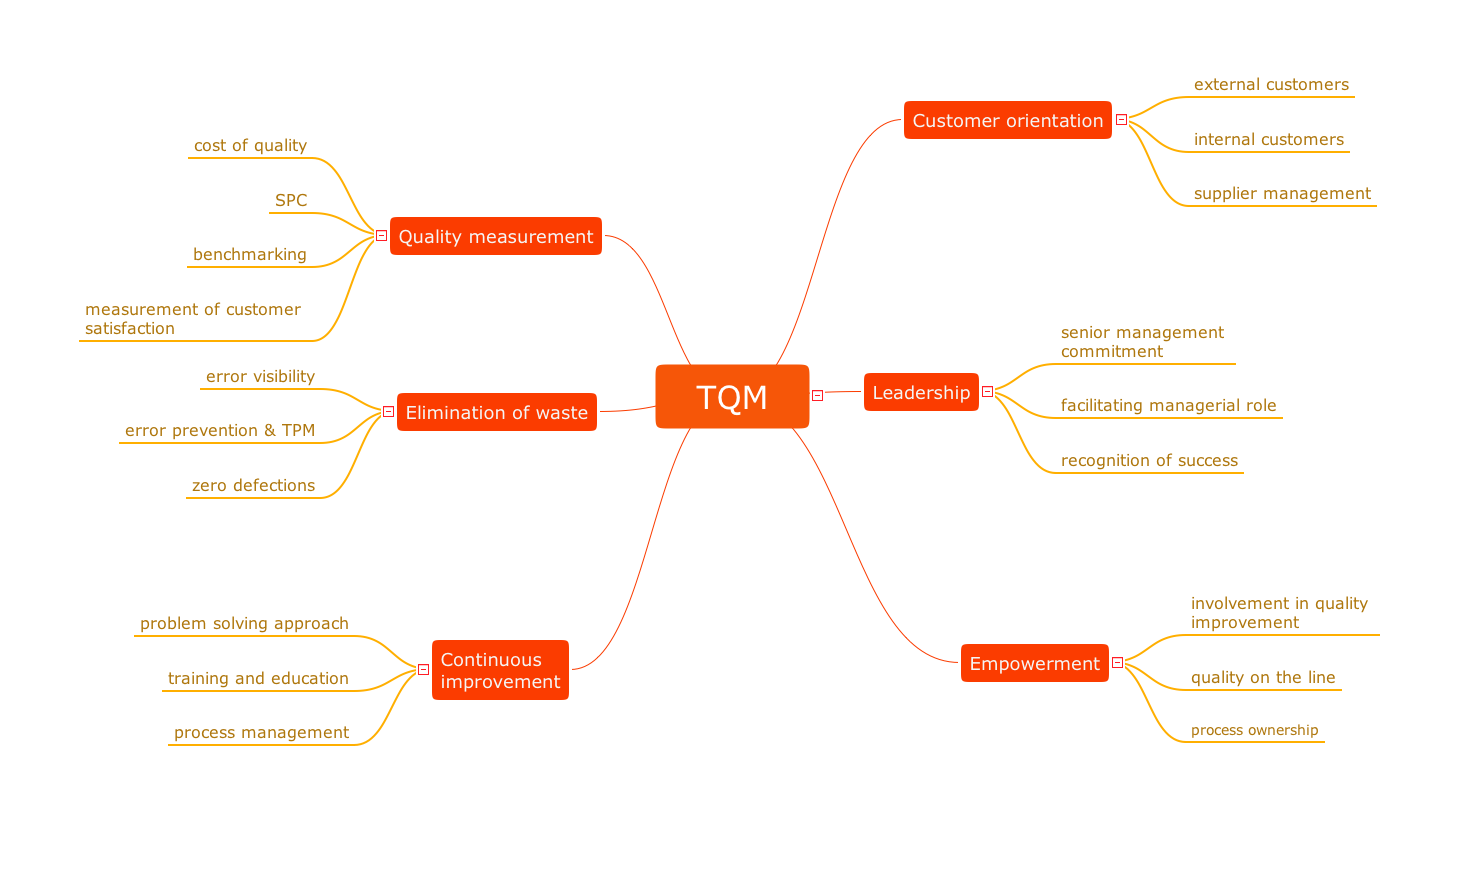
The Total quality management (TQM) is an enterprise-wide method of continuous quality improvement of all organizational processes, including the enhancement of ability to deliver high-quality products and services to the customers. The TQM includes eight main elements, which have great value: customer-focused, process-centered, total employee involvement, integrated system, continual improvement, strategic and systematic approach, fact-based decision making, communications. ConceptDraw PRO diagramming and vector drawing software offers the Total Quality Management Diagram solution with effective drawing tools, predesigned vector elements, samples and templates that help easy design the Total Quality Management diagrams, TQM flowcharts and Mind Maps widely used in quality management projects to visualize the business processes and industrial processes for your organization, to demonstrate the quality control step-by-step in a visual manner, to compare visually the ideal and real stages of processes.Mind Map - Quality Structure
ConceptDraw MINDMAP v7 is a good way to describe visual instructions on any quality process.Quality issues in heir organization
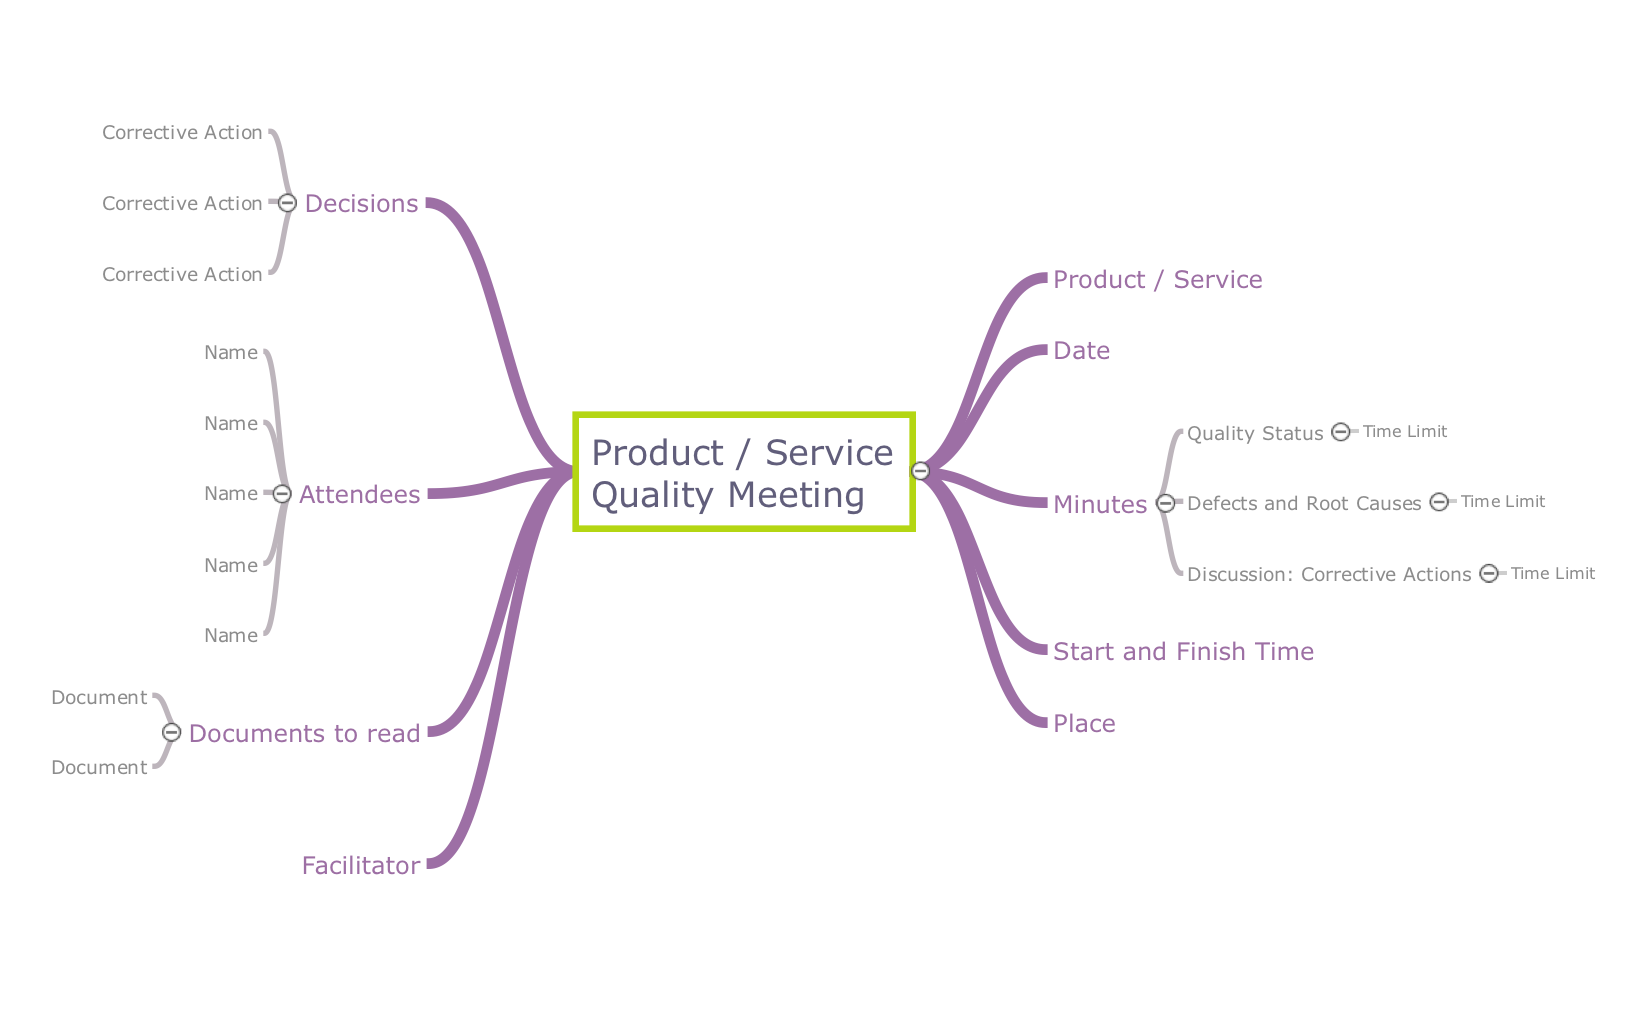
ConceptDraw Quality MindMap solution is a perfect additional tool for the quality team of your organization.Organizational Structure Total Quality Management
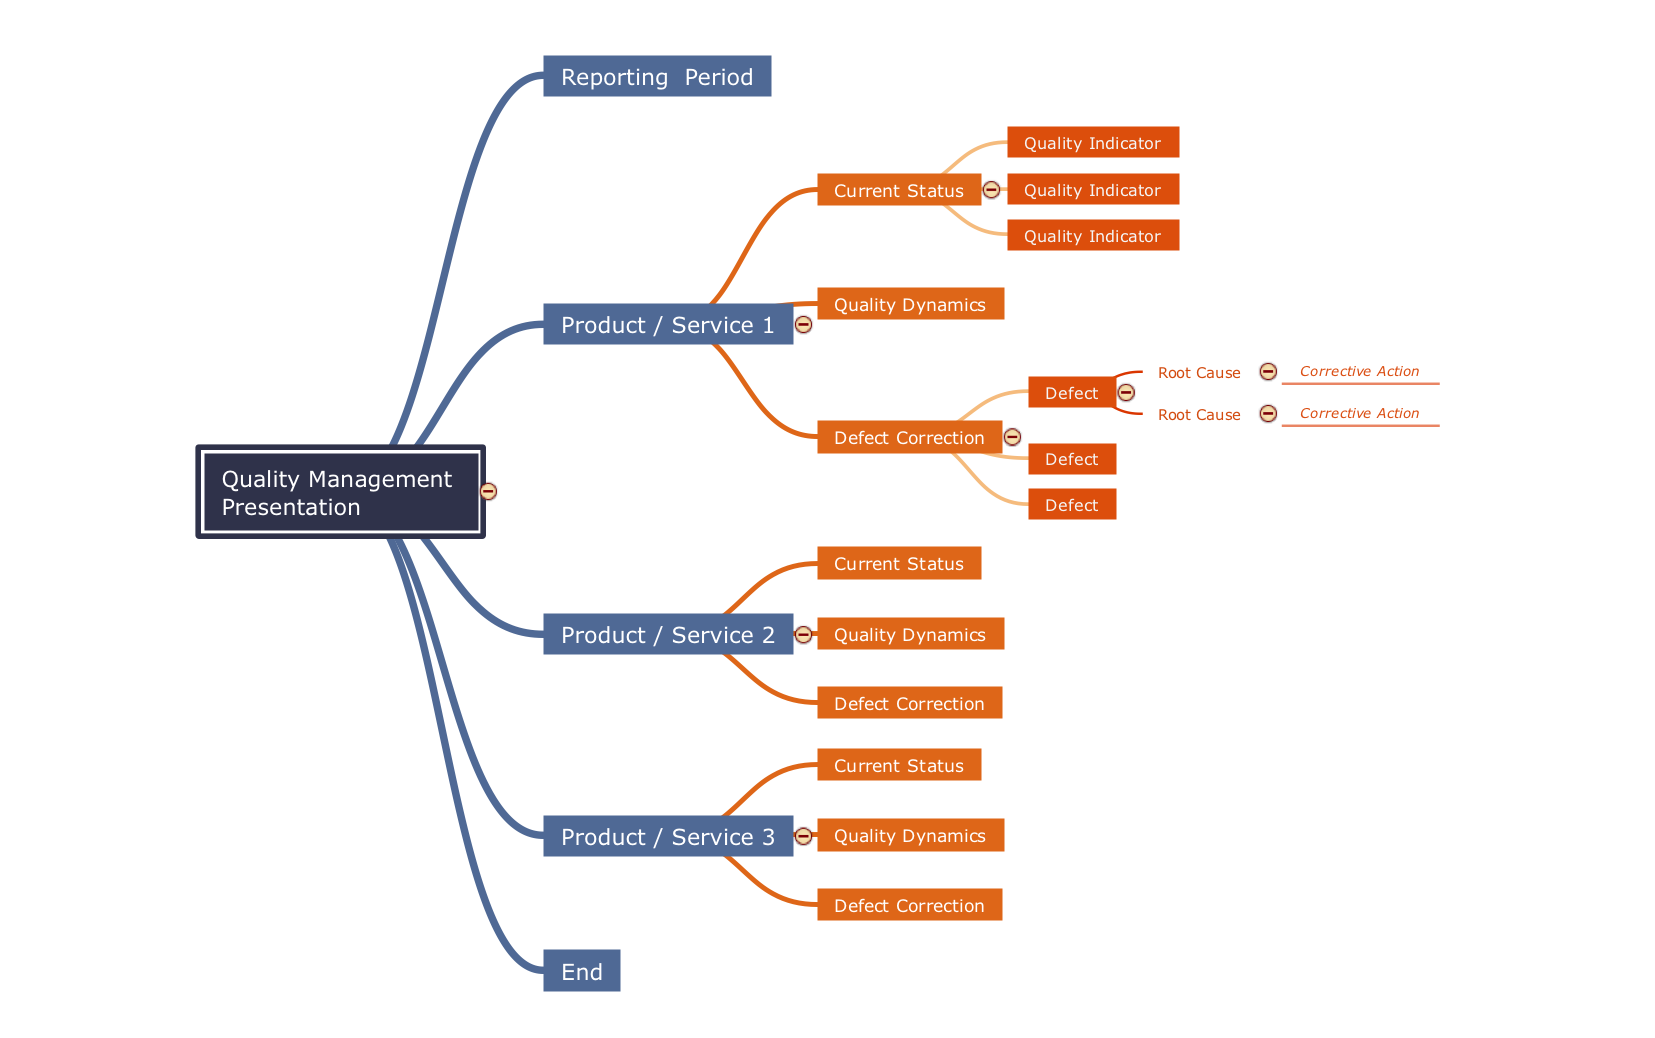
The Total Quality Management Diagram solution helps you and your organization visualize business and industrial processes. Create Total Quality Management diagrams for business process with ConceptDraw software.Mind Mapping in the Quality Management
ConceptDraw MINDMAP has a addition to the ConceptDraw Solution Park that provides a creative approach to visualizing quality processes, Quality Mind Map Solution.Probability Quality Control Tools
The Total Quality Management Diagram solution helps your organization visualize business and industrial processes. Create Total Quality Management diagrams for business process with ConceptDraw software.- Constant improvement of key performance indicators | What is a ...
- TQM Diagram — Professional Total Quality Management | Constant ...
- Performance Indicators | Constant improvement of key performance ...
- Constant improvement of key performance indicators | TQM Diagram ...
- Constant improvement of key performance indicators | Performance ...
- Constant improvement of key performance indicators | Key ...
- Constant improvement of key performance indicators
- Constant improvement of key performance indicators | Total Quality ...
- Constant improvement of key performance indicators | Quality Mind ...
- Constant improvement of key performance indicators
- Constant improvement of key performance indicators | Quality ...
- Performance Indicators | What is a KPI ? | KPI Dashboard | Key ...
- Quality Mind Maps - samples and templates | Quality Improvement ...
- Performance Indicators | What is a KPI ? | Enterprise dashboard ...
- Performance Indicators | KPI Dashboard | What is a KPI ? | Key ...
- Erd Key Performance Index
- Performance Indicators | PM Dashboards | Design elements - Sales ...
- PM Dashboards | Performance Indicators | Enterprise dashboard ...
- Sales Dashboard | Key Performance Indicators Graphs Excel
- Kpi Management Graphic

