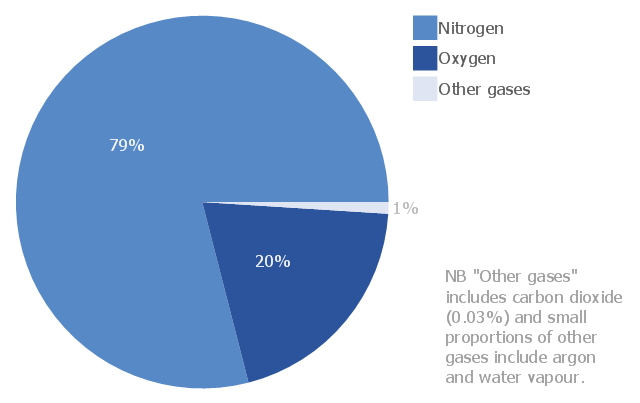
This pie chart sample shows the atmosphere air composition. It was designed on the base of the Wikimedia Commons file: Air composition pie chart.JPG.
[commons.wikimedia.org/ wiki/ File:Air_ composition_ pie_ chart.JPG]
This file is licensed under the Creative Commons Attribution-Share Alike 3.0 Unported license. [creativecommons.org/ licenses/ by-sa/ 3.0/ deed.en]
"The atmosphere of Earth is a layer of gases surrounding the planet Earth that is retained by Earth's gravity. The atmosphere protects life on Earth by absorbing ultraviolet solar radiation, warming the surface through heat retention (greenhouse effect), and reducing temperature extremes between day and night (the diurnal temperature variation).
The common name given to the atmospheric gases used in breathing and photosynthesis is air. By volume, dry air contains 78.09% nitrogen, 20.95% oxygen, 0.93% argon, 0.039% carbon dioxide, and small amounts of other gases. Air also contains a variable amount of water vapor, on average around 1%. Although air content and atmospheric pressure vary at different layers, air suitable for the survival of terrestrial plants and terrestrial animals currently is only known to be found in Earth's troposphere and artificial atmospheres." [Atmosphere of Earth. Wikipedia]
The pie chart example "Atmosphere air composition" was created using the ConceptDraw PRO diagramming and vector drawing software extended with the Pie Charts solution of the Graphs and Charts area in ConceptDraw Solution Park.
Process Flowchart
The main reason of using Process Flowchart or PFD is to show relations between major parts of the system. Process Flowcharts are used in process engineering and chemical industry where there is a requirement of depicting relationships between major components only and not include minor parts. Process Flowcharts for single unit or multiple units differ in their structure and implementation. ConceptDraw PRO is Professional business process mapping software for making Process flowcharts, Process flow diagram, Workflow diagram, flowcharts and technical illustrations for business documents and also comprehensive visio for mac application. Easier define and document basic work and data flows, financial, production and quality management processes to increase efficiency of your business with ConcepDraw PRO. Business process mapping software with Flowchart Maker ConceptDraw PRO includes extensive drawing tools, rich examples and templates, process flowchart symbols and shape libraries, smart connectors that allow you create the flowcharts of complex processes, process flow diagrams, procedures and information exchange. Process Flowchart Solution is project management workflow tools which is part ConceptDraw Project marketing project management software. Drawing charts, diagrams, and network layouts has long been the monopoly of Microsoft Visio, making Mac users to struggle when needing such visio alternative like visio for mac, it requires only to view features, make a minor edit to, or print a diagram or chart. Thankfully to MS Visio alternative like ConceptDraw PRO software, this is cross-platform charting and business process management tool, now visio alternative for making sort of visio diagram is not a problem anymore however many people still name it business process visio tools.
- Percentage Pie Chart . Pie Chart Examples | Approximate ...
- How to Draw the Different Types of Pie Charts | How to Create a Pie ...
- Atmosphere air composition | Process Flowchart | Pie Chart About ...
- Atmosphere air composition | Percentage Pie Chart . Pie Chart ...
- Percentage Pie Chart . Pie Chart Examples | Pie Graph Worksheets ...
- How To Draw A Pie Chart To Show The Approximate Percentage Of ...
- A Bar Graph On Components Of Air
- Example For Charts Composition
- Components Of Air And Their Quantity In A Bar Graph
- Bar Diagram Showing Different Elements Of Air
- Pie Charts | Percentage Diagram Air Quantity Nature
- Pie Chart Software | Donut Chart Templates | Pie Donut Chart. Pie ...
- Bar Diagram Showing Diffrent Elements Of Air
- Percentage Pie Chart . Pie Chart Examples | Venn Diagram ...
- Pie Chart Examples and Templates | Social Media Flowchart ...
- Composition Dashboard | Venn Diagram Examples for Problem ...
- Basic Diagramming | Basic Flowchart Symbols and Meaning ...
- Solving quadratic equation algorithm - Flowchart | Basic ...
- Determine The Equation Draw The Flow Diagram In Maths
- Mathematical Model Chart Daigarm

