Data Flow Diagram (DFD)
A Data Flow Diagram (DFD) illustrates the flow of data through an information system, visualizes how the information is handled in terms of inputs and outputs, how the data enter to system and leave it. It is effective to use a Data Flow Diagram for creation the system's overview, to show the system's scope and boundaries. There are two different types of notations for DFDs: Yourdon-Coad and Gane-Sarson, which differ in visual representations for processes, data flow, data stores, external entities, etc. Thus, for example the processes are depicted as circles in Yourdon-Coad notation and as rounded squares in Gane-Sarson notation. Gane-Sarson notation is usually used for visualization information systems and Yourdon-Coad - for system analysis and design. The Data Flow Diagrams solution included to Software Development area of ConceptDraw Solution Park offers a lot of DFD templates, samples and examples, libraries of vector stencils for construction without efforts the DFDs according to both Gane-Sarson and Yourdon-Coad notations.What Is Information Architecture
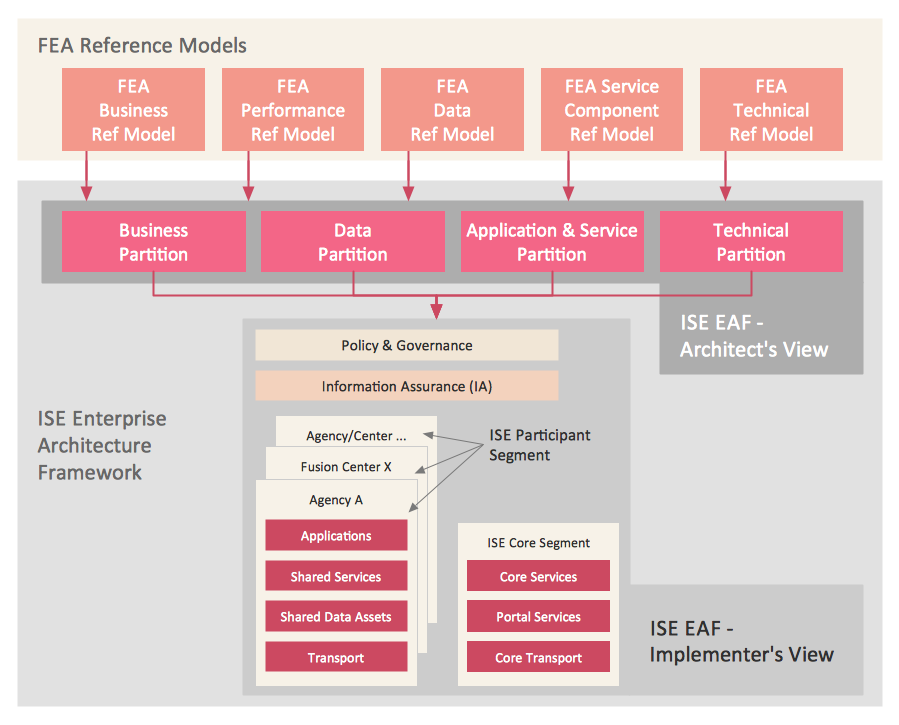
What is information architecture? Information architecture (IA) is a broad and abstract term. At the most general sense the information architecture describes the structure of a system, how the different pieces of information are related at the system and represents their relationships. The information architecture term was introduced by Richard Saul Wurman in 1975 and now is commonly used in the context of websites and intranets, information structures and computer systems. ConceptDraw DIAGRAM extended with Enterprise Architecture Diagrams Solution from the Management Area is the best software for design information architecture and drawing Enterprise Architecture Diagrams.Data Flow Diagram Process
Data Flow Diagram (DFD) is a hierarchy of functional processes, connected by data flows. The purpose of this presentation is to show how each process converts its inputs into outputs and to identify relationships between these processes. DFD is convenient way of modeling and construction the information processes, it step-by-step illustrates the flow of information in a process. For construction a DFD traditionally are used two different notations, which appropriate to the methods of Yourdon-Coad and Gane-Sarson. These notations slightly different from each other by graphical representation of symbols for processes, data stores, data flow, external entities. When designing a DFD it is required to decompose the system into the components (sub-systems), for explaining a complex system you may need represent numerous levels. The Data Flow Diagrams solution from ConceptDraw Solution Park contains numerous predesigned DFD symbols for both notations, which help easy and effectively design professional-looking Data Flow Diagrams (DFDs) and DFD Process Diagrams.- Context Diagram Sample Billing
- Data Flow Diagram Of Billing System
- Data Flow Diagram Symbols. DFD Library | Context Diagram ...
- Audit Flowchart Symbols | Invoice payment process - Flowchart ...
- Process Flowchart | Account Flowchart Stockbridge System ...
- Process Flowchart | Context Diagram Template | Block Diagram ...
- Invoice payment process - Flowchart
- Example of DFD for Online Store (Data Flow Diagram )
- Accounting Information Systems Flowchart Example
- Architectural Context Diagram Example
- Account Flowchart Stockbridge System. Flowchart Examples ...
- Data Flow Diagram Symbols. DFD Library | Context Diagram ...
- Accounting Flowcharts | Data Flow Diagram Process | How Do You ...
- Library System Flowchart Sample
- Data Flow Diagram | Basic Flowchart Symbols and Meaning | Data ...
- Example of DFD for Online Store (Data Flow Diagram ) DFD ...
- Manual Library System Context Diagram
- Billing Flow Chart
- Process Flowchart | Credit Card Processing System UML Diagram ...
- Account Flowchart Stockbridge System. Flowchart Examples | Data ...


