This site uses cookies. By continuing to browse the ConceptDraw site you are agreeing to our Use of Site Cookies.

Understanding the Audit Process: A Comprehensive Guide. Audit Process Flowchart

Audit Process Flowchart, Audit Flowchart - Audit Flowcharts solution for ConceptDraw DIAGRAM Solution Park provides the Audit Flowcharts library with wide variety of predesigned audit flowchart symbols, and also the set of templates and samples allowing you design your own audit flowchart or audit process flowchart in one moment. Simply use any of offered samples and change it for your needs, or fill the desired template.

Business Process Modeling Tools

ConceptDraw DIAGRAM the best business process modeling tools.contains pre-designed libraries and templates based on the BPMN 2.0 standard that allows to create of both simple and complex (nested) models of processes.

A Study of the Business Value of Total Quality Management

The Total Quality Management Diagram solution helps your organization visualize business and industrial processes. Create Total Quality Management diagrams for business process with ConceptDraw software.
"A continual improvement process, also often called a continuous improvement process (abbreviated as CIP or CI), is an ongoing effort to improve products, services, or processes. These efforts can seek "incremental" improvement over time or "breakthrough" improvement all at once. Delivery (customer valued) processes are constantly evaluated and improved in the light of their efficiency, effectiveness and flexibility.
Some see CIPs as a meta-process for most management systems (such as business process management, quality management, project management, and program management)." [Continual improvement process. Wikipedia]
The affinity diagram example "Implementing continuous process improvement" was created using the ConceptDraw PRO diagramming and vector drawing software extended with the solution "Seven Management and Planning Tools" from the Management area of ConceptDraw Solution Park.
Affinity diagram
Affinity diagram, Affinity diagrams,

Hiring Process

Hiring process is a set of actions taken by an organization for attracting, selecting and appointing suitable candidates for jobs. The steps of the hiring process can vary and include unique elements according to the company's specificity. However, there are some common basic steps. ConceptDraw DIAGRAM diagramming and vector drawing software aspires to help its users in the hiring process and offers a powerful HR Flowcharts Solution from the Management Area of ConceptDraw Solution Park. Illustrate the most common steps in the hiring process fast and easily in ConceptDraw DIAGRAM.

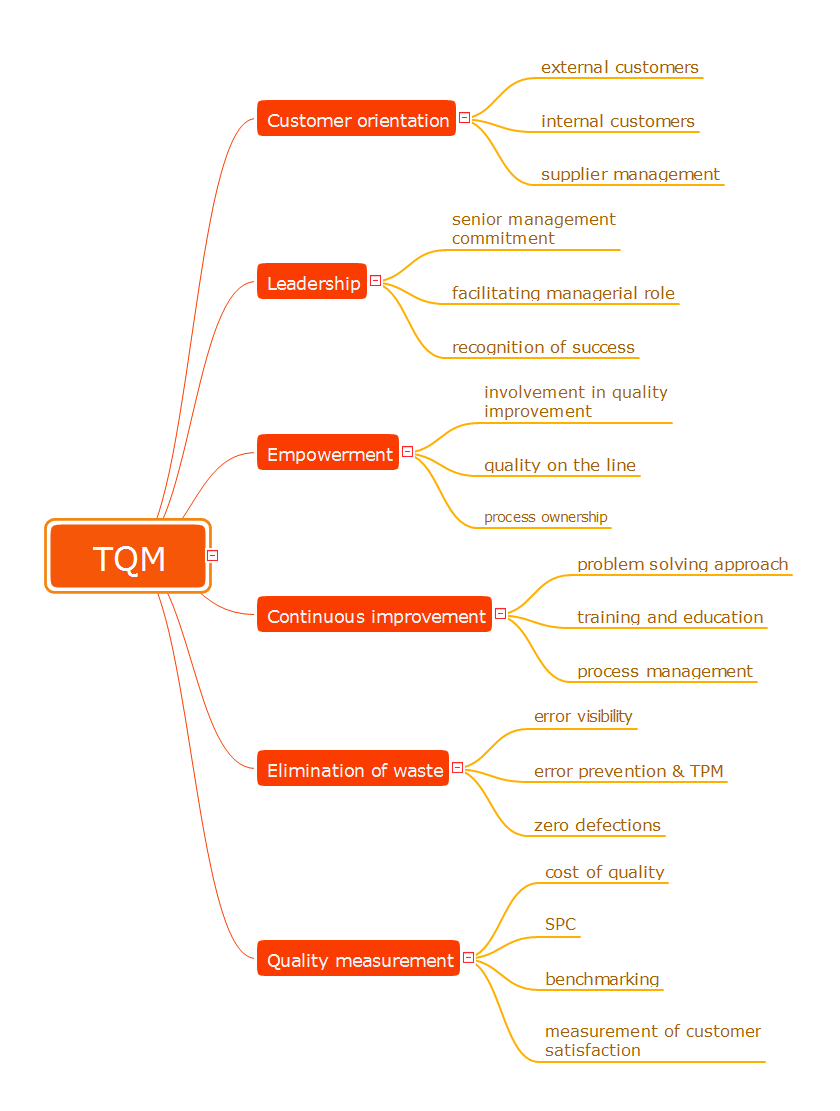
TQM Diagram Example

The Total Quality Management Diagram solution helps you and your organization visualize business and industrial processes. Create Total Quality Management diagrams for business process with ConceptDraw software.

Flowchart Definition

Flowchart definition - A Flowchart is a diagram that graphically represents the structure of the system, the flow of steps in a process, algorithm, or the sequence of steps and decisions for execution a process or solution a problem. For depiction the steps there are used specific shapes and graphic symbols which are linked by lines and directional arrows. The main standard shapes are rectangle or box, rounded box, diamond, circle. A Flowchart is a convenient way to observe the follow the process from beginning to end, it lets improve the work of process, highlight the key elements and detach not essential or even excessive steps. The Flowcharts can represent different levels of detail: High-Level Flowchart, Detailed Flowchart, and Deployment or Matrix Flowchart. They are incredibly useful for programmers when developing the programs of any complexity and on any high level language. Create your own Flowcharts using the ConceptDraw DIAGRAM diagramming and vector drawing software and powerful tools of Flowcharts solution from "Diagrams" area.

TQM Software — Build Professional TQM Diagrams

The Total Quality Management Diagram solution helps you and your organization visualize business and industrial processes. Create Total Quality Management diagrams for business process with ConceptDraw software.

Quality Management System

ConceptDraw DIAGRAM diagramming and vector drawing software extended with Total Quality Management (TQM) Diagrams solution from the Quality area of ConceptDraw Solution Park perfectly suits for development and visually representing a Quality Management System.

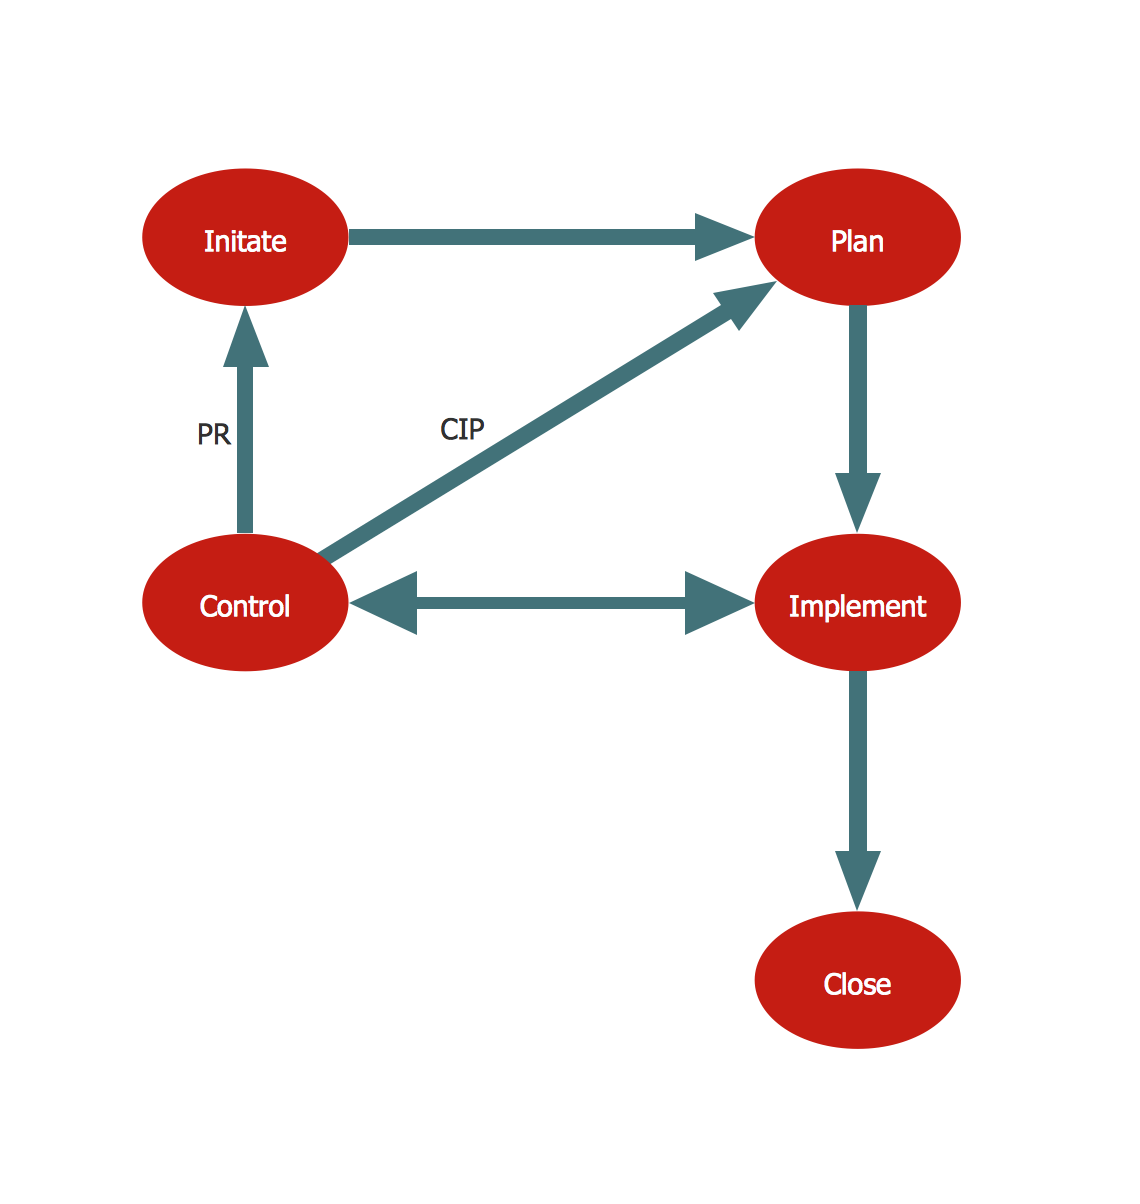
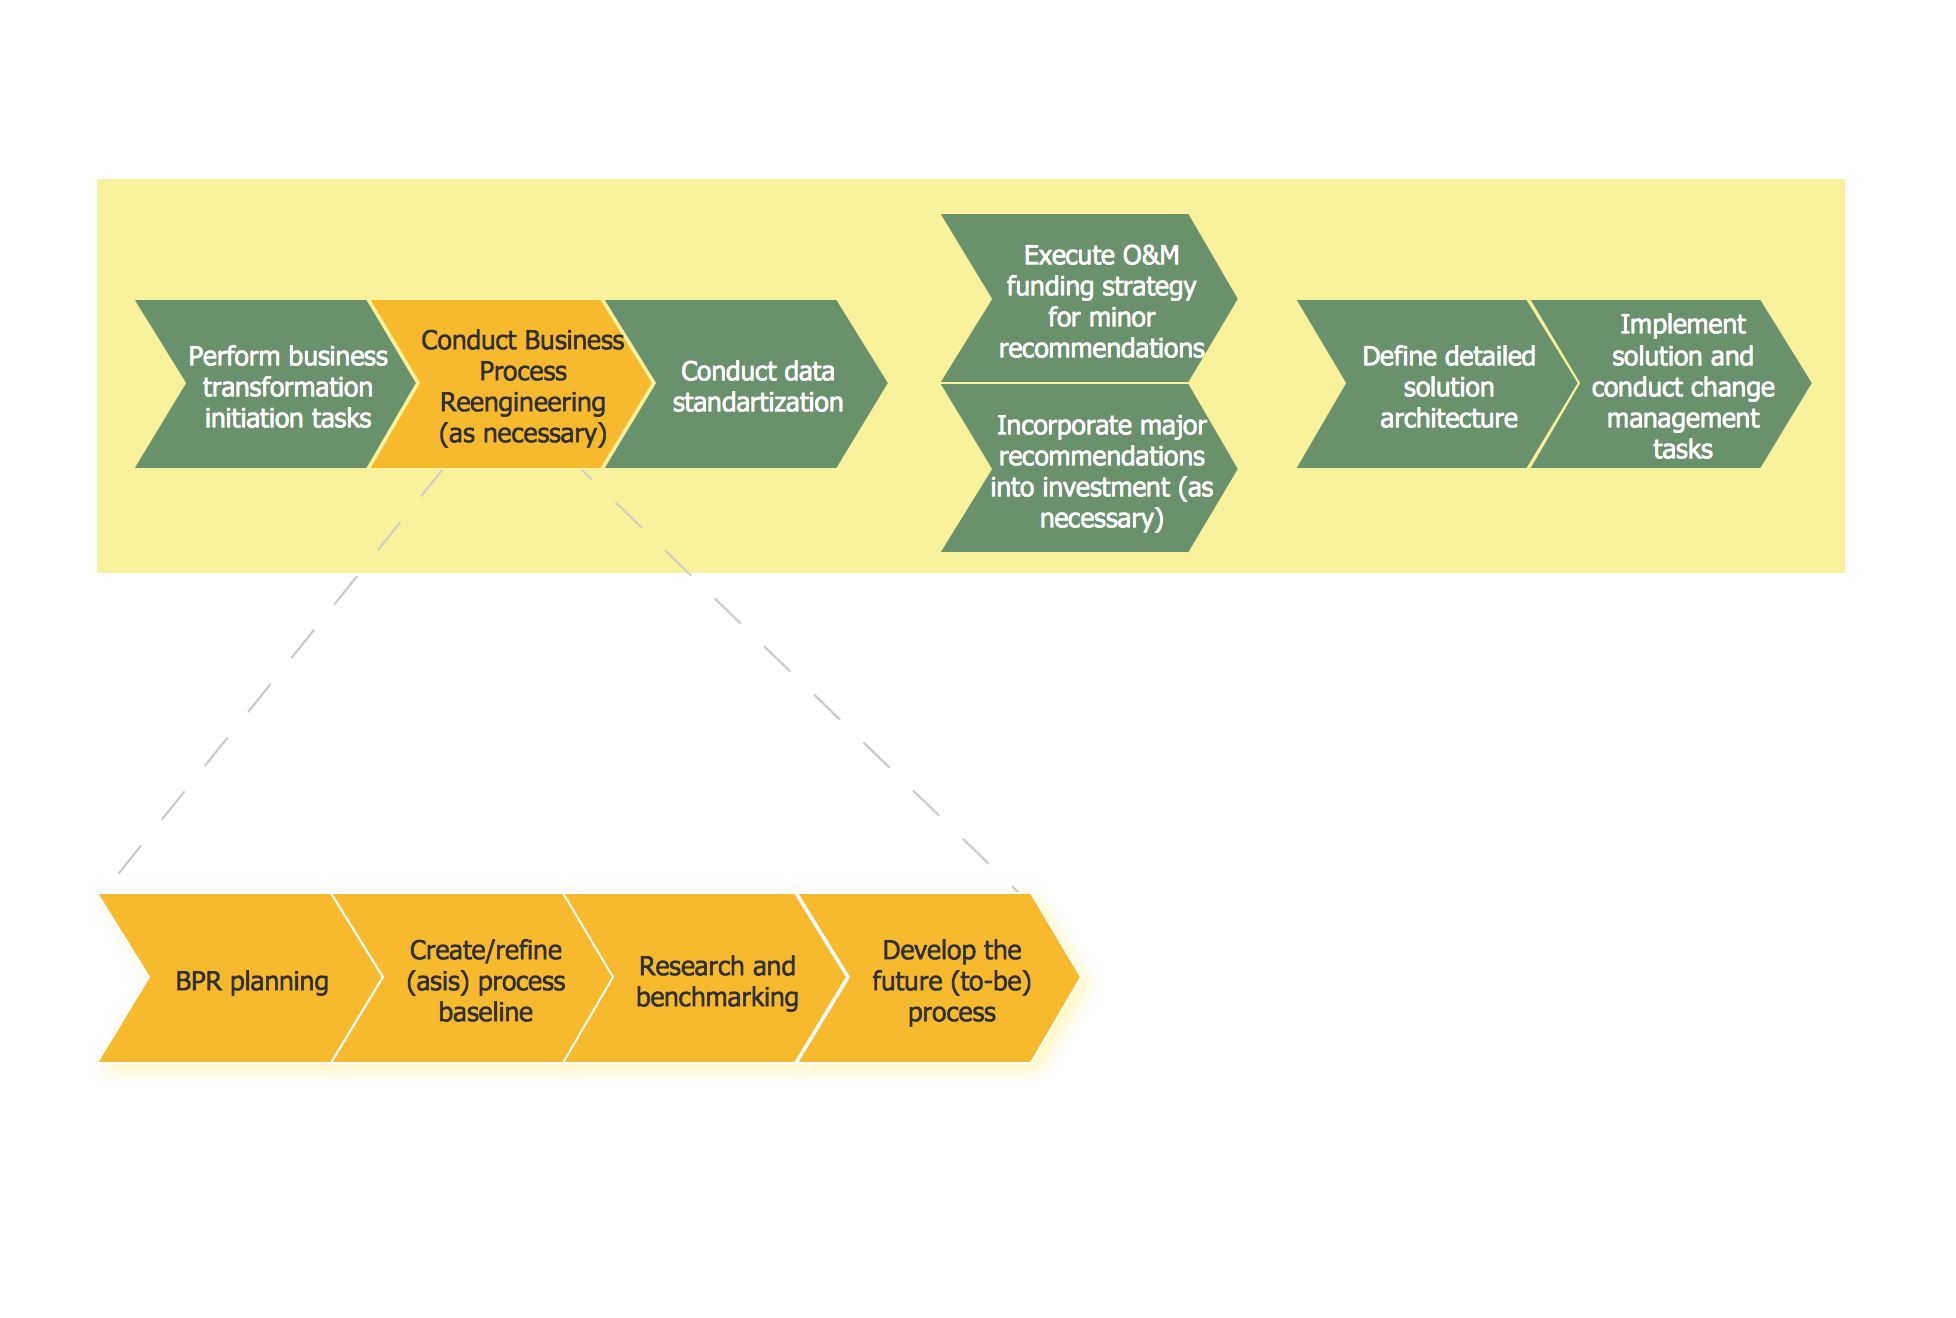
Business Process Reengineering. Business Process Example

This sample shows the Business Process Reengineering Diagram, displays the Continuous Improvement Process (CIP) directed at the permanent improvement of the processes. This sample can be used in business process management, quality management, project management and program management.
The vector stencils library "TQM diagrams" contains 58 TQM symbols. Use it in business process re-engineering, total quality management, continuous improvement, and quality solutions to draw cause-and-effect diagrams, top-down, and cross-functional process flow charts in the ConceptDraw PRO diagramming and vector drawing software extended with the Total Quality Management (TQM) Diagrams solution from the Quality area of ConceptDraw Solution Park.
Transportation
Transportation, transportation,
Inbound Goods
Inbound Goods, inbound goods,
Storage
Storage, storage,
Procedure
Procedure, procedure,
Operation
Operation, operation,
Operation/ Inspection
Operation/ Inspection, operation, inspection,
Issue
Issue, issue,
Organization Function
Organization Function, organization function,
2-Part Function
2-Part Function, 2-part function, two-part function,
Decision 1 (TQM)
Decision 1 (TQM), decision,
Decision 2 (TQM)
Decision 2 (TQM), decision,
Multi in/out Decision (Multi-Input on right)
Multi in/out Decision (Multi-Input on right), multi in/out decision, multi-input,
Multi in/out Decision (Multi-Input on left)
Multi in/out Decision (Multi-Input on left), multi in/out decision, multi-input,
External Organization
External Organization, external organization,
External Process
External Process, external process,
Inspection/Measurement
Inspection/Measurement, inspection, measurement,
Metric
Metric, metric,
2-part metric
2-part metric, 2-part metric, two-part metric,
System Database
System Database, system database,
System Support
System Support, system support,
System Function
System Function, system function,
Delay
Delay, delay,
Connector (TQM)
Connector (TQM), connector,
Off-Page Reference
Off-Page Reference, off-page reference,
Connected Issues
Connected Issues, connected issues,
Fabrication (black)
Fabrication (black), fabrication,
Fabrication (white)
Fabrication (white), fabrication,
Move (black)
Move (black), move,
Move (white)
Move (white), move,
Store (black)
Store (black), store, storage,
Store (white)
Store (white), store, storage,
Inspection (black)
Inspection (black), inspection,
Inspection (white)
Inspection (white), inspection,
Selectable Process (All White)
Selectable Process (All White), selectable process,
Selectable Process ('Fabrication' Black)
Selectable Process ('Fabrication' Black), selectable process, fabrication,
Selectable Process ('Move' Black)
Selectable Process ('Move' Black), selectable process, move,
Selectable Process ('Store' Black)
Selectable Process ('Store' Black), selectable process, store,
Selectable Process ('Inspection' Black)
Selectable Process ('Inspection' Black), selectable process, inspection,
Work Flow Loop 1
Work Flow Loop 1, work flow loop,
Work Flow Loop 2
Work Flow Loop 2, work flow loop,
Feedback Arrow
Feedback Arrow, feedback arrow,
X-Function - Vertical
X-Function - Vertical, X-function,
X-Function - Horizontal
X-Function - Horizontal, X-function,
Force-Field Analysis
Force-Field Analysis, force-field analysis,
Cause 1
Cause 1, cause,
Cause 2
Cause 2, cause,
Cause 3
Cause 3, cause,
Category
Category, category,
Effect
Effect, effect,
Fish Frame
Fish Frame, fish frame, cause-and-effect, fishbone,
Dynamic Connector
Dynamic Connector,
Result
Result, result,
No Result
No Result, no result,
Branch: Return
Branch: Return,
Branch: No Return
Branch: No Return,
Interrupt
Interrupt, interrupt,
External Control
External Control, external control,
Refinement
Refinement, refinement,

Total Quality Management Definition

The Total Quality Management Diagram solution helps you and your organization visualize business and industrial processes. Create Total Quality Management diagrams for business process with ConceptDraw software.
HelpDesk

How to Create a SIPOC Diagram

SIPOC (suppliers, inputs, process, outputs, customers) diagram is focused on the quality of a business process inputs and outputs. SIPOC diagram has a form of a segmented table that gives a comprehensive outline for each category. SIPOC diagram depicts the start and end of a process and the relationships between a company and its suppliers. SIPOC diagram is an important part of the Six Sigma methodology. With its Business Process Mapping solution, ConceptDraw DIAGRAM offers a powerful set of process mapping tools to empower quality management within an organization.

PROBLEM ANALYSIS. Identify and Structure Factors

Identify and Structure Factors. Use the Affinity Diagram to collect and structure factors that impact on a problem. ConceptDraw Office suite is a software for identify and structure factors with affinity diagram. This is a grouping and structuring of factors that impact on a problem.
7MP Tools
7MP Tools

Kanban Board Software: A Comprehensive Overview

Kanban Board Software is incredibly useful tool that allows a team to work effective and productive, to analyze and improve the business processes, and visualize the workflows. ConceptDraw DIAGRAM with its numerous solutions is a powerful Kanban Board Software! Draw your own professional looking Kanban Board Diagrams quick, easy and effective with useful tools of ConceptDraw DIAGRAM diagramming and vector drawing software.

Organizational Structure Total Quality Management

The Total Quality Management Diagram solution helps you and your organization visualize business and industrial processes. Create Total Quality Management diagrams for business process with ConceptDraw software.

seven management and planning tools Seven Management and Planning Tools

seven management and planning tools
Seven Management and Planning Tools solution extends ConceptDraw DIAGRAM and ConceptDraw MINDMAP with features, templates, samples and libraries of vector stencils for drawing management mind maps and diagrams.

Total Quality Management Value

The Total quality management (TQM) is an enterprise-wide method of continuous quality improvement of all organizational processes, including the enhancement of ability to deliver high-quality products and services to the customers. The TQM includes eight main elements, which have great value: customer-focused, process-centered, total employee involvement, integrated system, continual improvement, strategic and systematic approach, fact-based decision making, communications. ConceptDraw DIAGRAM diagramming and vector drawing software offers the Total Quality Management Diagram solution with effective drawing tools, predesigned vector elements, samples and templates that help easy design the Total Quality Management diagrams, TQM flowcharts and Mind Maps widely used in quality management projects to visualize the business processes and industrial processes for your organization, to demonstrate the quality control step-by-step in a visual manner, to compare visually the ideal and real stages of processes.

quality management mind map, quality management mindmap Quality Mind Map

quality management mind map, quality management mindmap
In order to create any needed mind map, the ConceptDraw DIAGRAM diagramming and drawing software can be used. The Quality Mind Map solution provides the pre-made quality mind map templates, samples and stencil libraries full of design elements. Having such great starting points for identifying, tracking and addressing all the quality initiatives in your organization, you can start using the Quality Mind Map solution right now editing the existing examples and so creating the unique and good-looking drawings. It is useful for a wide range of business specialists, analysts, project managers, creative managers, project members, marketers, teachers and many other specialties.

segmented cycle diagrams, basic circular arrows diagrams, circular flow Basic Circular Arrows Diagrams

segmented cycle diagrams, basic circular arrows diagrams, circular flow
Basic Circular Arrows Diagrams solution extends ConceptDraw DIAGRAM with predesigned samples and a library of vector stencils allowing one to create the Circular Arrows diagrams for any purpose or need. Start with one desired of ready-made vector stencils or samples, use it as a circular flow diagram template and make the Circular Arrow Diagram with the required quantity of sectors in a few minutes. Finally, customize your diagram, make stylish changes using the contrasting colors for different steps or identical for some of them, to highlight the most important steps, so designing a diagram the best fitting your taste.