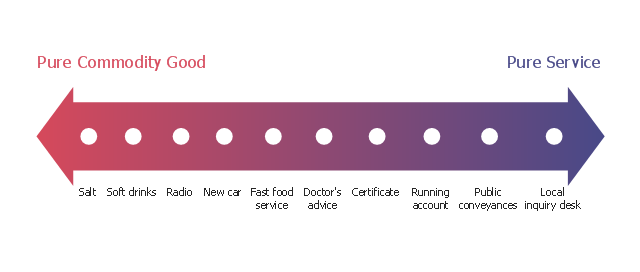
The dichotomy between physical goods and intangible services is an oversimplification; these are not discrete categories. Most business theorists see a continuum with pure service at one endpoint and pure commodity goods at the other endpoint. Most products fall between these two extremes. Goods are normally structural and can be transferred in an instant while services are delivered over a period of time. Goods can be returned while a service once delivered cannot. Goods are not always tangible and may be virtual. [Goods and services. Wikipedia]
This service-goods continuum diagram example was created using ConceptDraw PRO diagramming and vector drawing software extended with Marketing Diagrams solution from Marketing area of ConceptDraw Solution Park.
[ www.conceptdraw.com/ solution-park/ marketing-diagrams ]
 Marketing Diagrams
This solution extends ConceptDraw PRO with samples, templates and library of design elements for drawing the marketing diagrams.
- Pyramid Chart Examples | Marketing Diagrams | Service-goods ...
- Venn diagrams with ConceptDraw PRO | Pie Chart Examples | Basic ...
- Fishbone Diagram | Marketing | Marketing Diagrams |
- Porter's value chain matrix diagram | Swot Analysis Examples | Swot ...
- Fishbone Diagram | Management | Marketing Diagrams |
- Value pyramid - Marketing diagram | Pyramid Diagrams | Social ...
- Fishbone Diagram | Business Productivity Diagramming ...
- Positioning map (Perceptual map) | SWOT Analysis Solution ...
- Pyramid Chart Examples | Marketing Diagrams | Business Processes |
- Flow Diagram Software | Pyramid Diagram | Pyramid Diagram |
- How to Draw a Computer Network Diagrams | Business Diagram ...
- Flowchart Process Example | Pyramid Chart Examples | Business ...
- Business diagrams & Org Charts with ConceptDraw PRO | Cross ...
- Flowchart Example: Flow Chart of Marketing Analysis | Marketing ...
- SWOT Analysis Software
- Marketing Diagrams |
- Porter's value chain matrix diagram
