Organizational Charts with ConceptDraw DIAGRAM
Organizational chart or Orgchart is a diagram that depicts the structure of an organization using the terms of work responsibility and rank position. It is a useful and convenient format to visually illustrate the relationships within an organization, which is moreover applicable for organization of any size. Typically, an Organizational chart is constructed from the rectangular object blocks, which represent a job title, a person's name and relationships associated with them. You looks for the powerful Orgchart software? ConceptDraw DIAGRAM software is exactly what you've been searching long. Extended with Organizational Charts Solution, ConceptDraw DIAGRAM offers great-looking examples and samples of Orgcharts, built-in templates and various types of predesigned vector block objects and connectors for creation all kinds of Organizational Charts - from simple to complex multi-page. When designing the chart for large organization with complex branched structure, may be convenient to divide it into few smaller charts.SDL — Systems Engineering
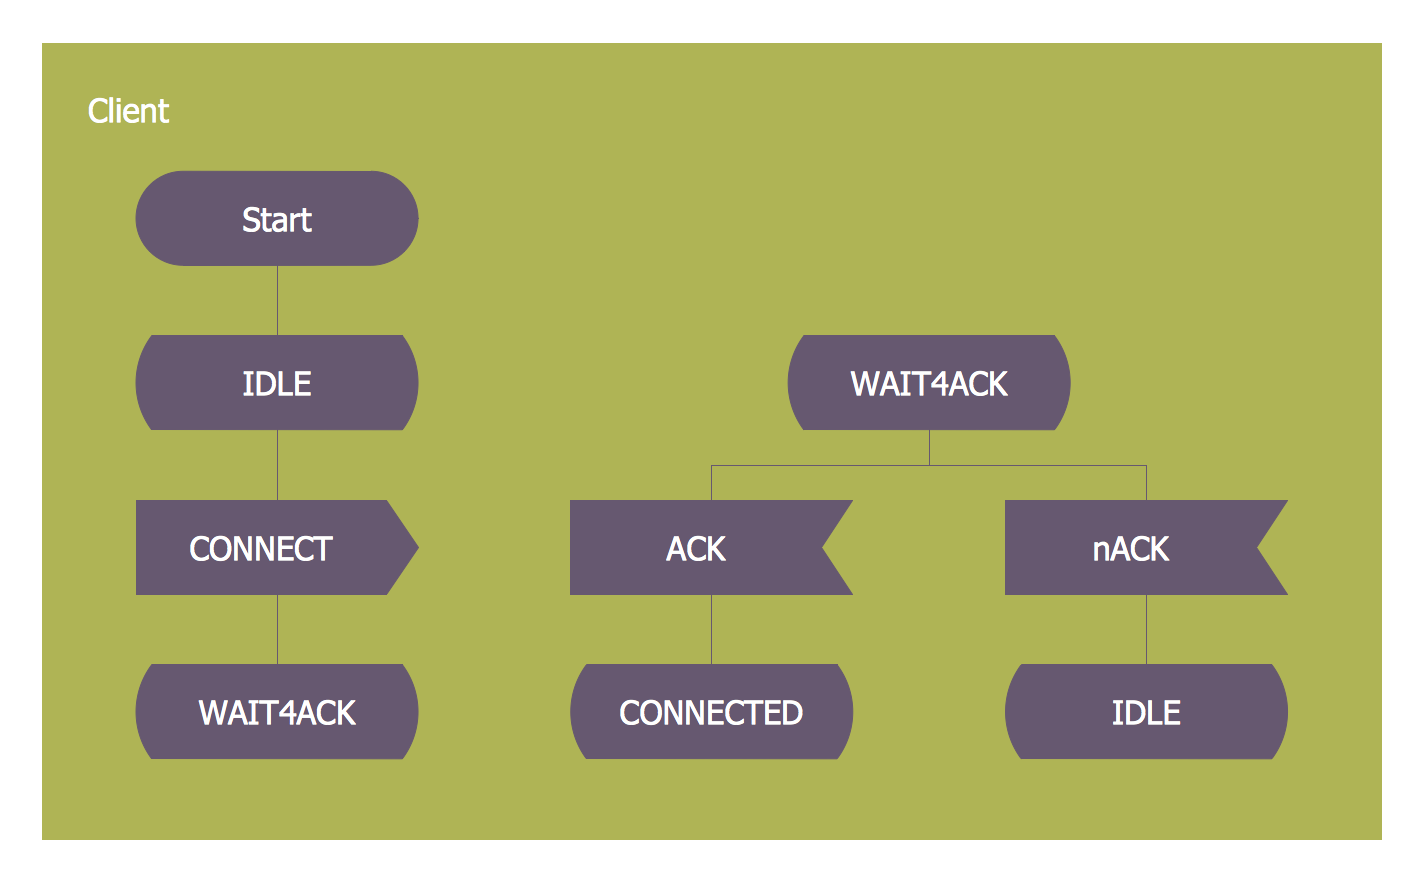
How to design SDL Diagram fast and easy? ConceptDraw DIAGRAM diagramming and vector drawing software supplied with unique Specification and Description Language (SDL) Solution from the Industrial Engineering Area of ConceptDraw Solution Park will help you design SDL Diagram of any complexity without efforts6 sigma
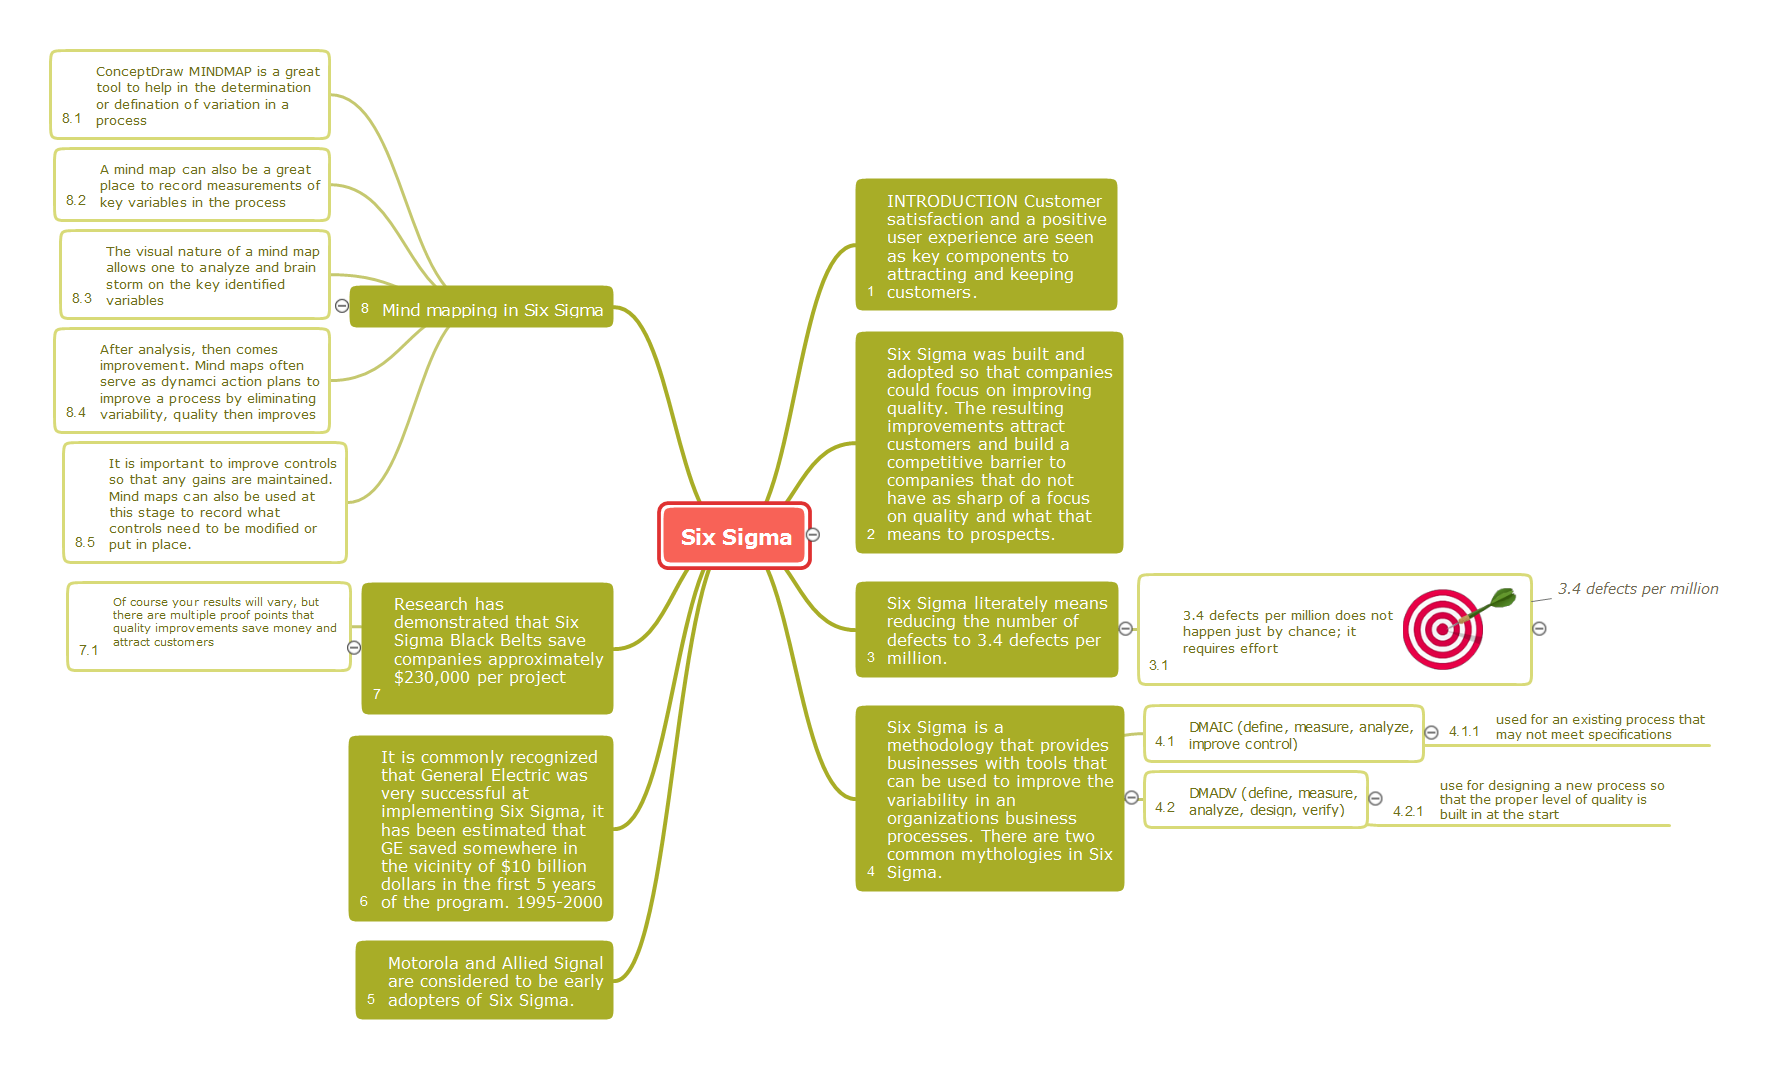
6 Sigma is a popular management concept aimed at improving the quality of work of an organization or individual units and at continuous perfection the processes. The improvement of organization's activities may be executed through the radical changes or in consequence to minor regular improvements. The main purposes of these improvements may be increasing of product safety, improvement quality, decreasing the quantity of defects, shorter the manufacturing cycle, improvement the workplaces, reducing costs, etc. Currently, Six Sigma is applied by organizations of various activity spheres, from the industrial enterprises to the banks. 6 Sigma uses a set of different tools of quality for realizing the improvements and control the processes. Each organization applies its own set of tools, such as Pareto chart, Ishikawa diagram, Tree diagram, etc. Solutions from the Quality area of ConceptDraw Solution Park support quality and manufacturing managers with powerful visualization tools for production quality control and improvement, and supply the ConceptDraw MINDMAP software with Quality Management Mind Maps. This map illustrates how the Six Sigma methodology can be represented as a Mind Map.
 Telecommunication Network Diagrams
Telecommunication Network Diagrams solution extends ConceptDraw DIAGRAM software with samples, templates, and great collection of vector stencils to help the specialists in a field of networks and telecommunications, as well as other users to create Computer systems networking and Telecommunication network diagrams for various fields, to organize the work of call centers, to design the GPRS networks and GPS navigational systems, mobile, satellite and hybrid communication networks, to construct the mobile TV networks and wireless broadband networks.
 Business Process Mapping
The Business Process Mapping solution for ConceptDraw DIAGRAM is for users involved in process mapping and creating SIPOC diagrams.
Process Flowchart
The main reason of using Process Flowchart or PFD is to show relations between major parts of the system. Process Flowcharts are used in process engineering and chemical industry where there is a requirement of depicting relationships between major components only and not include minor parts. Process Flowcharts for single unit or multiple units differ in their structure and implementation. ConceptDraw DIAGRAM is Professional business process mapping software for making Process flowcharts, Process flow diagram, Workflow diagram, flowcharts and technical illustrations for business documents and also comprehensive visio for mac application. Easier define and document basic work and data flows, financial, production and quality management processes to increase efficiency of your business with ConcepDraw DIAGRAM. Business process mapping software with Flowchart Maker ConceptDraw DIAGRAM includes extensive drawing tools, rich examples and templates, process flowchart symbols and shape libraries, smart connectors that allow you create the flowcharts of complex processes, process flow diagrams, procedures and information exchange. Process Flowchart Solution is project management workflow tools which is part ConceptDraw Project marketing project management software. Drawing charts, diagrams, and network layouts has long been the monopoly of Microsoft Visio, making Mac users to struggle when needing such visio alternative like visio for mac, it requires only to view features, make a minor edit to, or print a diagram or chart. Thankfully to MS Visio alternative like ConceptDraw DIAGRAM software, this is cross-platform charting and business process management tool, now visio alternative for making sort of visio diagram is not a problem anymore however many people still name it business process visio tools.
How To use Building Plan Examples
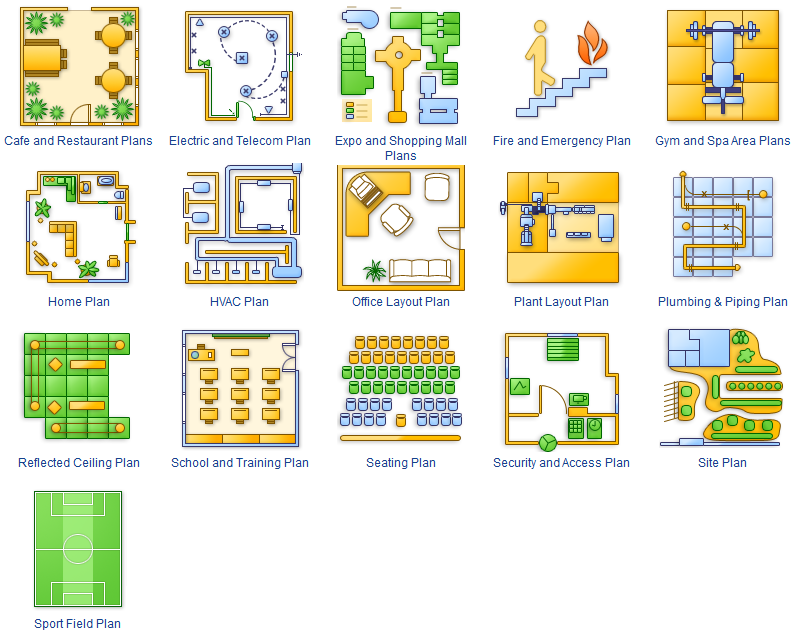
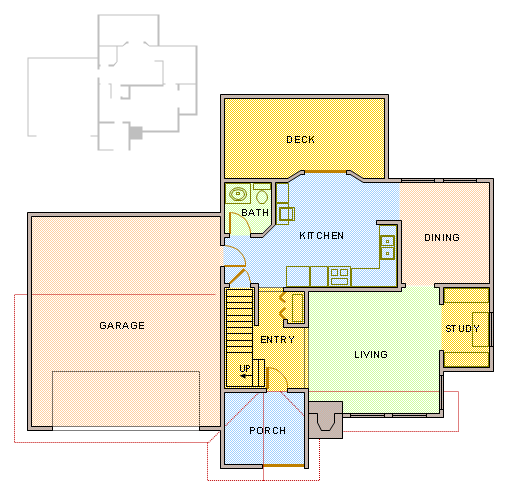
The Building plans of different types, Floor plans, Layout schemes which are necessary and obligatory for construction various types of buildings, are designed by architects and building engineers. It is very desirable the availability of special auxiliary software for professional representation them. Exactly such software is a ConceptDraw DIAGRAM extended with numerous solutions from the Building Plans area. How to make a Building plan with ConceptDraw DIAGRAM ? The good foundation is collection of predesigned Building Plan examples and samples, including Architectural house plans, House floor plans, Residential building plans, Pole building plans, Storage building plans, Commercial building plans, Office floor plans, Office layout plans, Restaurant building plans, Salon floor plan, Electrical layout plans, Fire and Emergency plans, Site plans, Plans of building services, Furniture and Equipment layouts, and many others. Simply select desired and the most suitable example and make your own perspective plan or professional design proposal on its base.
How To use Architect Software
Professional building design and architect software are very popular among the modern designers, architects, and builders. They help visualize the building ideas, building concepts, effectively develop detailed building and architect design projects. ConceptDraw DIAGRAM diagramming and vector drawing software supplied with extensive Building Plans area is a powerful architect software. It allows professionally design and construct your home, office, school, shop, deck or landscape in a few minutes. It is a fastest way to create the Building plans, Floor plans, Home Floor plans, Electrical diagrams, Landscapes, Facility plans, Store layouts, and many other plans, drawings, and designs. You can use a lot of built-in templates, samples and examples offered by the building solutions of ConceptDraw Solution Park, we recommend to start with the exact template you need, then customize it with large variety of predesigned vector stencils to fit your needs, this lets to find an expected result quickly and without efforts.
Program Evaluation and Review Technique (PERT) with ConceptDraw DIAGRAM
Program Evaluation and Review Technique (abbr. PERT) is a method developed by Ministry of Defense of the USA in 1958 for the project of creation the missile system Polaris. PERT diagram is one of the tools for project management that lets greatly simplify the planning and scheduling of large and complex projects. PERT diagram provides evaluation of project run-time and labor forces, it helps to analyze the time necessary for execution each of project tasks and the whole project, and to calculate the project critical path. PERT chart depicts the set of tasks connected each other in order of their execution and is constructed according to one of definite rules - AOA (activity on arrow) or AON (activity on node). It doesn't give you ready concrete decisions, but helps to find them. Design easy the PERT diagrams in ConceptDraw DIAGRAM software enhanced with Seven Management and Planning Tools solution from Management area of ConceptDraw Solution Park. You have a possibility to build the PERT chart of any type, but AON variant is easier for building and perception.
 Marketing Diagrams
Marketing Diagrams solution extends ConceptDraw DIAGRAM diagramming software with abundance of samples, templates and vector design elements intended for easy graphical visualization and drawing different types of Marketing diagrams and graphs, including Branding Strategies Diagram, Five Forces Model Diagram, Decision Tree Diagram, Puzzle Diagram, Step Diagram, Process Chart, Strategy Map, Funnel Diagram, Value Chain Diagram, Ladder of Customer Loyalty Diagram, Leaky Bucket Diagram, Promotional Mix Diagram, Service-Goods Continuum Diagram, Six Markets Model Diagram, Sources of Customer Satisfaction Diagram, etc. Analyze effectively the marketing activity of your company and apply the optimal marketing methods with ConceptDraw DIAGRAM software.
- Drawing Of Organization Structure Of Medium Size Construction
- Electrical Contractor Organizational Chart
- Organogram Software | Organizational Structure Total Quality ...
- Electrical Company Organizational Chart
- An Organization Chart Of A Medium Construction Company Daergram
- How to Draw an Organization Chart | Organogram Software ...
- Organizational Chart Template
- Process Flowchart | Organizational Charts with ConceptDraw PRO ...
- Business Report Pie. Pie Chart Examples | Examples of Flowcharts ...
- Hvac Organization Chart
- Flowchart Layout Of A Construction Company
- Free Gym And Spa Organizational Plan
- Competitor Analysis | SWOT Analysis | SWOT Matrix Template ...
- UML Class Diagram Example - Apartment Plan | Financial Trade ...
- Block diagram - Gap model of service quality | Business Process ...
- Cross-Functional Process Map Template | Business Process ...
- Europe browser usage share | Mechanics - Vector stencils library ...
- Store Layout Software | How To Create Restaurant Floor Plan in ...
- Formal garden | How to Design Landscape | How to Draw a ...
- Cisco Network Templates | How To use Switches in Network ...


