Control and Information Architecture Diagrams (CIAD) with ConceptDraw DIAGRAM
One of the three main constituents of any enterprise is the Control and Information Architecture. The rest two are Production facilities and People and Organization.Electrical Drawing Software and Electrical Symbols
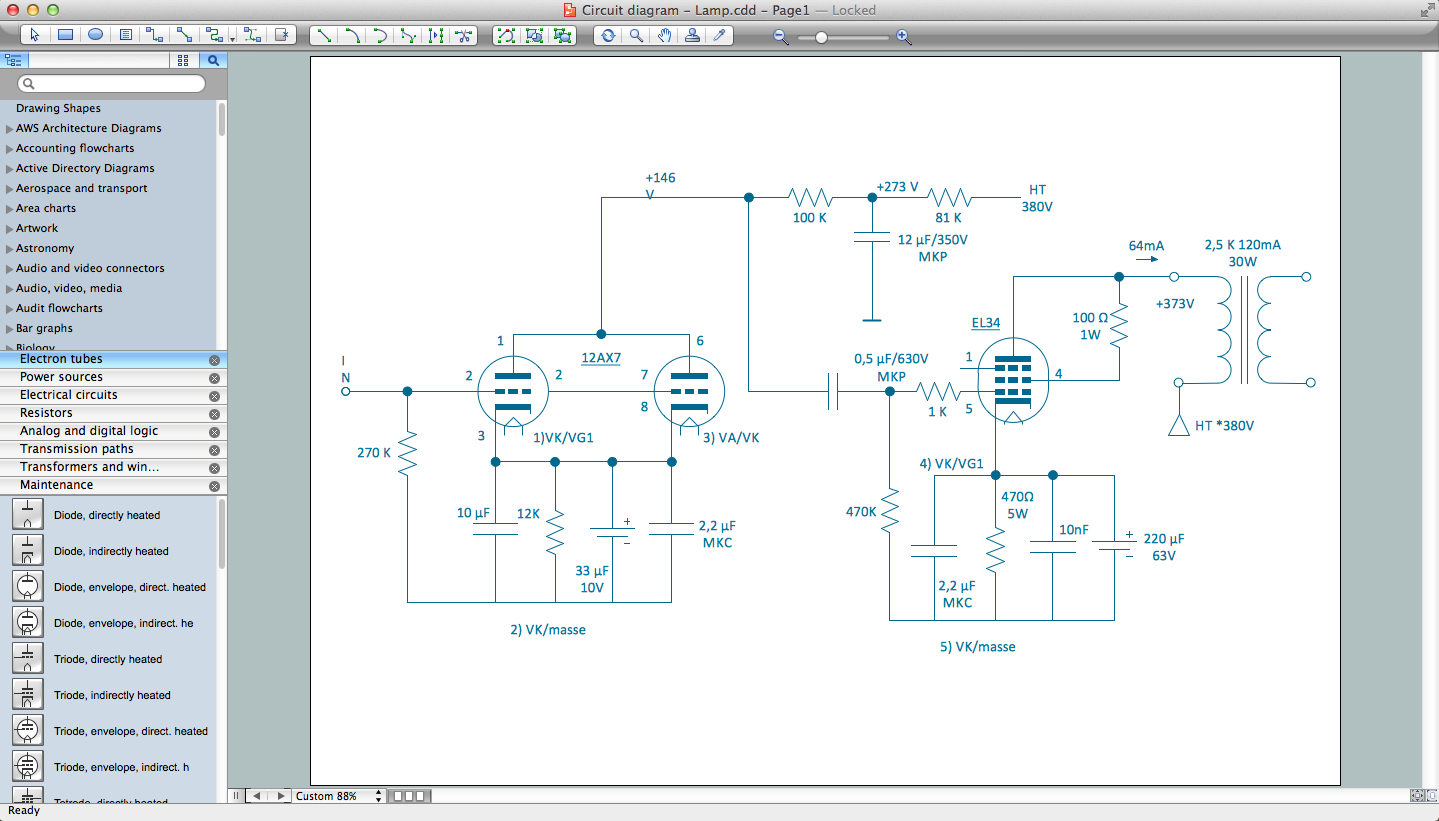
Any electrical device could not be created without electrical diagram, wiring also cannot be laid without pre-designed and approved scheme or plan. Electrical drawing is a type of technical drawing that depicts scheme of some electrical device and includes the information about power, lighting, etc. Electrical plan designed for architectural or engineering project visually displays location of electrical devices and connections. ConceptDraw DIAGRAM is ideal electrical software for construction professional-looking Electrical Circuits, Electrical Schematics, Electrical Layouts, Electrical Wiring, Automotive Wiring, Cabling Layout Diagrams, Circuits and Logic Schematics, Logic Gate Diagrams, Digital Circuits, Parallel Circuits, Blue Prints with help of 926 standard electrical symbols offered by 26 libraries of Electrical Engineering solution from the Engineering area for ConceptDraw DIAGRAM. It makes drawing Electrical diagrams very easy even for beginners, and also extends your work with various export methods.Quality Control Chart Software — ISO Flowcharting
Quality Control Chart Software (ISO Flowcharting) - ConceptDraw DIAGRAM extended with Total Quality Management TQM Diagrams Solution from the Quality Management Area is the best diagramming and vector drawing software that allows you to draw the quality control charts quick and easy. The quality control chart is a graphic that illustrates the accordance of processes or products to the intended specifications and degree of differences from them. Depending on what type of data you need analyze, there are used different types of quality control charts: X-bar charts, S charts, Np charts.UML Diagrams with ConceptDraw DIAGRAM
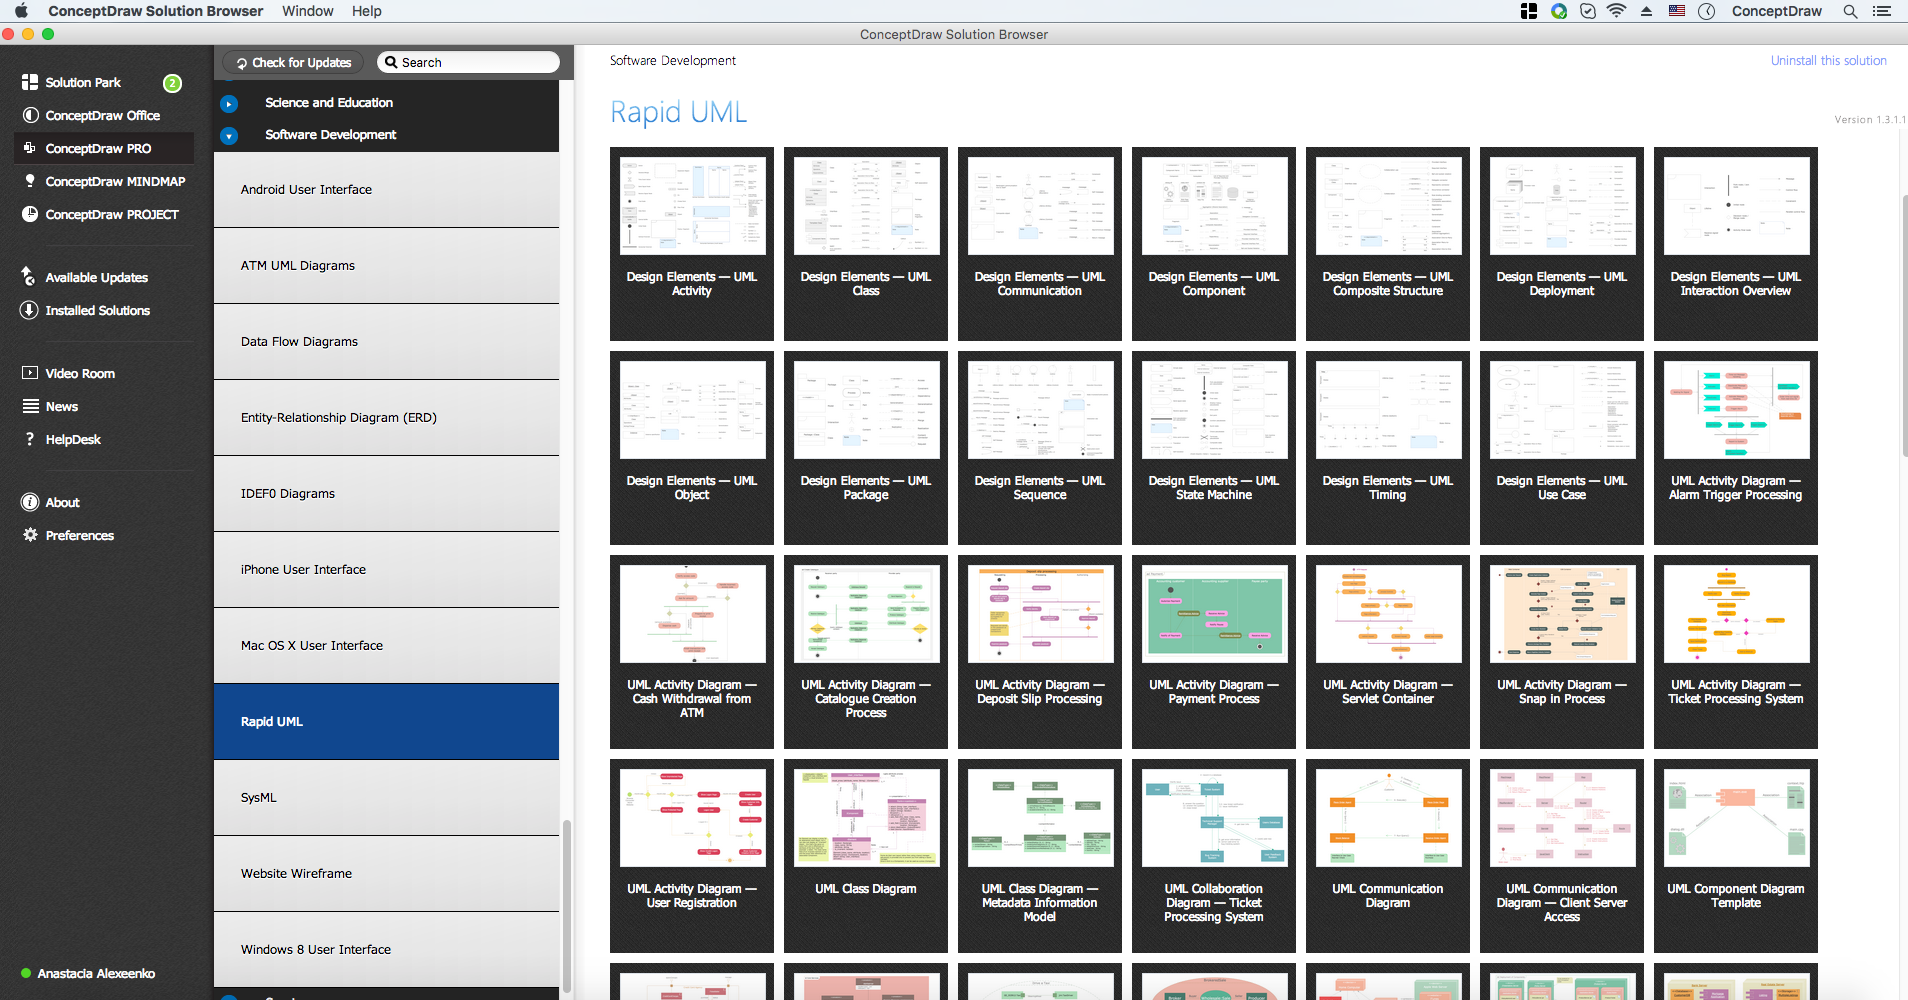
Unified Modeling Language (UML) is a single modeling language that is used in software engineering to represent effectively the structure of complex computer systems and software. Such visual models in form of UML diagrams allow simplify the process of software development, let to meet the deadlines, improve the final software products, and also facilitate communication process between the customer, system analysts and programmers. The UML language defines standards for operations, methods of programming languages, and their terminology. The main types of UML diagrams are: Activity diagram, Use Case diagram, Deployment diagram, Statechart diagram, Class diagram, Component diagram, Sequence diagram, Collaboration diagram. ConceptDraw DIAGRAM extended with Rapid UML solution is a professional software that provides perfect possibility of easy designing detailed UML diagrams. It offers large number of task-oriented templates and predesigned vector stencils that correspond to standard UML diagram notation. Use them to instantly design the UML diagrams.The Best Flowchart Software Available
ConceptDraw gives the ability to draw Flowchart documents. Flowcharts solutionis a powerful tool that extends ConceptDraw application for drawing business flowcharts. ConceptDraw DIAGRAM ector diagramming and business graphics software enhanced with with templates, green and interactive flowchart makers, samples and stencil libraries from ConceptDraw Solution Park which all focused to help with drawing flowcharts, block diagrams, bar charts, histograms, pie charts, divided bar diagrams, line graphs, area charts, scatter plots, circular arrows diagrams, Venn diagrams, bubble diagrams, concept maps, and others.
Diagramming Software for Design UML Package Diagrams
UML Package Diagram illustrates the functionality of a software system.
Best Program to Make Workflow Diagrams
ConceptDraw DIAGRAM is the best program to make workflow diagrams. With the new Arrows10 technology it brings features allow you make workflow diagrams faster then ever before. These features allow you to focus on thinking, not drawing, that makes ConceptDraw DIAGRAM the best program to make workflow diagrams.Diagramming Software for Design UML Component Diagrams
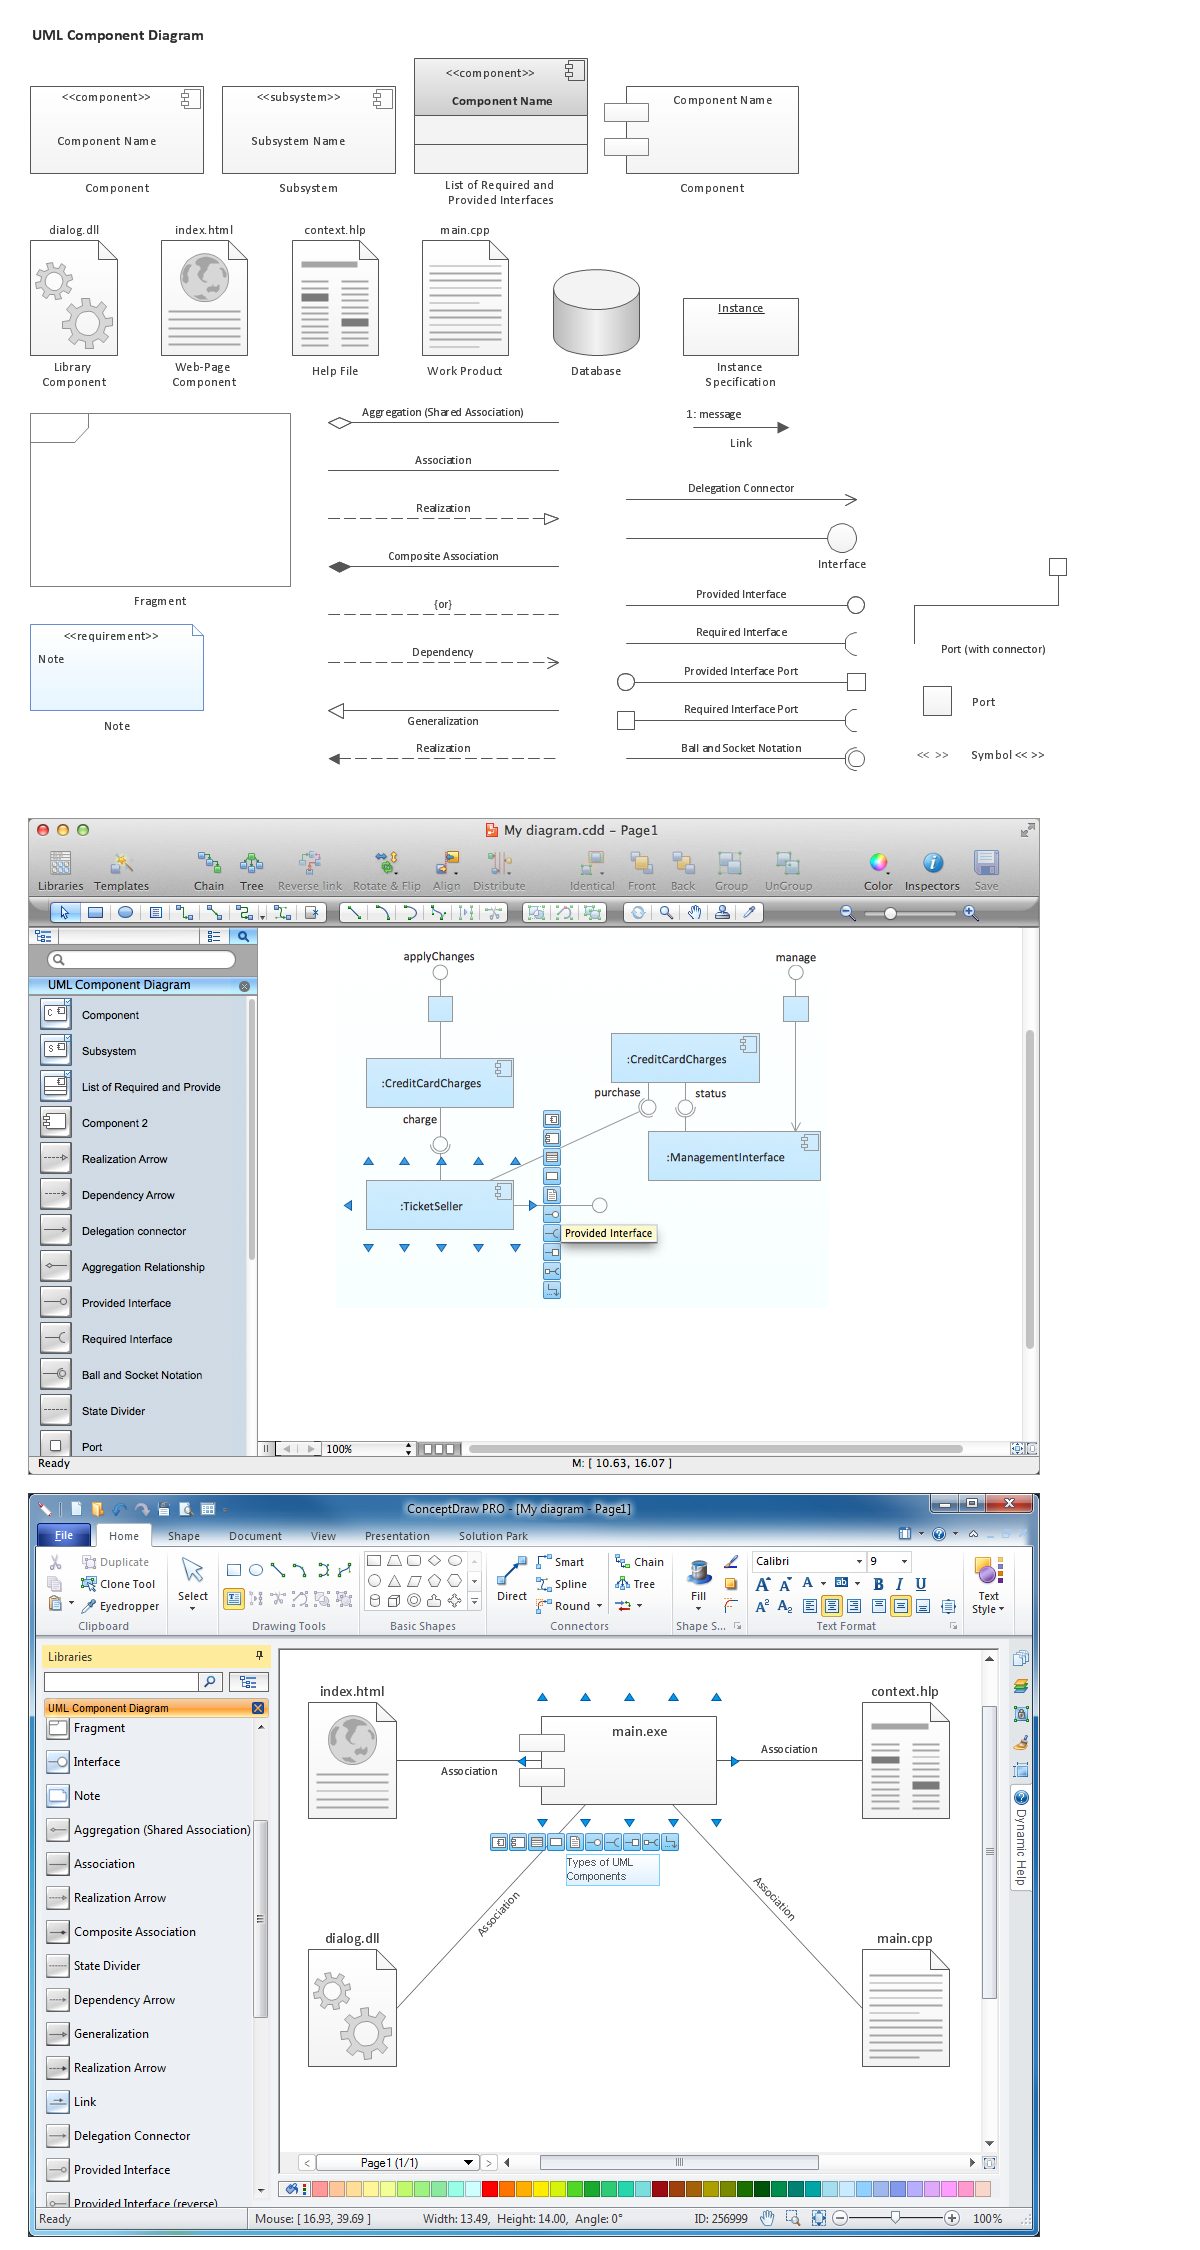
UML Component Diagram illustrate how components are wired together to larger components and software systems that shows the structure of arbitrarily complex systems. ConceptDraw Rapid UML solution delivers libraries contain pre-designed objects fit UML notation, and ready to draw professional UML Component Diagram.
Basic Diagramming
Perfect charts and graphics diagramming software with rich examples and template. ConceptDraw is ideal to draw Charts and Graphics.
How to Draw EPC Diagram Quickly
An event-driven process chain diagram is a flowchart used in business process analysis. It evolved from Architecture of Integrated Information Systems (ARIS) and utilised in the business process improvement and analysis. It is also used to facilitate enterprise resource planning. An EPC diagram is a complex flowchart that shows different business processes through various workflows. The workflows are seen as functions and events that are connected by different teams or people, as well as tasks that allow business processes to be executed. ConceptDraw DIAGRAM is a software for making EPC diagrams that allows managers visually present business process models for making decisions for business.
- Control Block Diagram Drawing Software
- Hvac Diagram Software
- How to Draw a Pareto Chart Using ConceptDraw PRO | Network ...
- Block Diagrams | Design elements - HVAC control equipment ...
- Quality Control Chart Software — ISO Flowcharting | Work Flow ...
- Computer Aided Quality Control Block Diagram
- TQM Diagram Example | Quality Control Chart Software — ISO ...
- Hvac Wiring Diagram Software
- Use Microsoft Visio To Draw Control System Block Diagram
- Process Flowchart | Quality Control Chart Software — ISO ...


