Business process Flow Chart — Event-Driven Process chain (EPC) diagrams
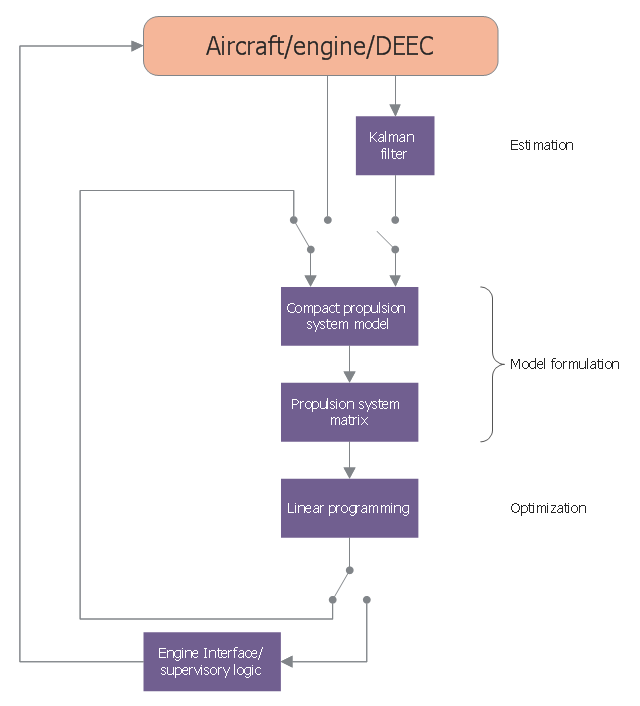
Event-Driven Process chain Diagrams for improvement throughout an organisation. Best software for Process Flow Diagram. The Event-driven Process Chain (EPC) Diagrams allows managers to plan processes and resources.This CFD sample was designed on the base of Wikimedia Commons file: Performance seeking control flow diagram.jpg.
[commons.wikimedia.org/ wiki/ File:Performance_ seeking_ control_ flow_ diagram.jpg]
Source of this CFD is Subsonic Flight Test Evaluationof a Performance Seeking ControlAlgorithm on an F-15 Airplane NASA Technical Memorandum 4400. [nasa.gov/ centers/ dryden/ pdf/ 88262main_ H-1808.pdf]
The CFD example "Control flow diagram - Performance Seeking" was designed using ConceptDraw PRO software extended with Сlassic Business Process Modeling solution from Business Processes area of ConceptDraw Solution Park.
Used Solutions
Functional Flow Block Diagram
You need to draw a Functional Flow Block Diagram? You are an artist? Now it doesn't matter. With Block Diagrams solution from the "Diagrams" area for ConceptDraw Solution Park you don't need more to be an artist to design the Functional Flow Block Diagram of any complexity.Software Diagram Examples and Templates
ConceptDraw DIAGRAM is a powerful tool for business and technical diagramming. Software Development area of ConceptDraw Solution Park provides 5 solutions: Data Flow Diagrams, Entity-Relationship Diagram (ERD), Graphic User Interface, IDEFO Diagrams, Rapid UML.
 Classic Business Process Modeling
The ConceptDraw DIAGRAM software enhanced with Classic Business Process Modeling solution is a powerful flowchart maker and professional business process modeling software with extensive choice of drawing tools, libraries with wide variety of ready-to-use vector objects that are more than sufficient for modeling the business processes and for instant creation variety of diagram types: Control Flow Diagram, Swimlane Diagram, Business Process Modeling Diagram, Functional Flow Block Diagram, Data Flow Diagram. It is ideal for business analysts, developers, as well as for managers and regular users. The samples included to Classic Business Process Modeling solution allow to uncover the solution’s power and to answer qualitatively on how to create a flowchart or to model the business processes with help of diagrams and schemes.
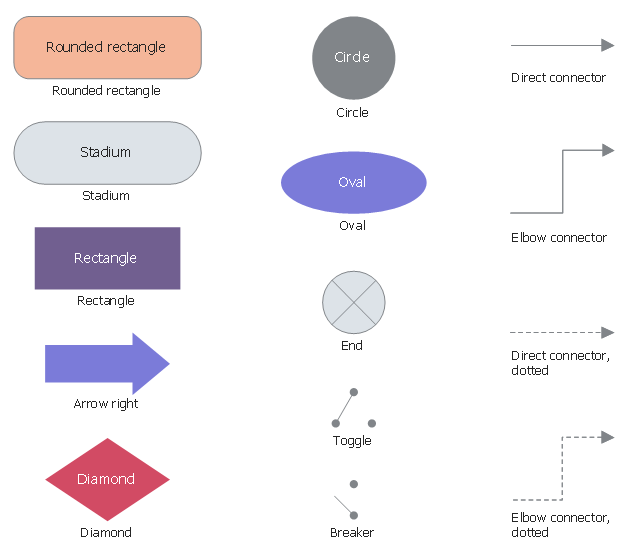
The vector stencils library "Control flow diagram" contains 14 CFD notation symbols.
Use it to draw your control flow diagrams with ConceptDraw PRO software.
The CFD symbols example "Design elements - Control flow diagram" is included in Сlassic Business Process Modeling solution from Business Processes area of ConceptDraw Solution Park.
Use it to draw your control flow diagrams with ConceptDraw PRO software.
The CFD symbols example "Design elements - Control flow diagram" is included in Сlassic Business Process Modeling solution from Business Processes area of ConceptDraw Solution Park.
HelpDesk
Event-driven Process Chain (EPC) Diagram Software
An EPC diagram is a type of flowchart used in business process analysis. It shows different business processes through various work flows. The workflows are shown as processes and events that are related to different executes and tasks that allow business workflow to be completed. An EPC diagram shows different business processes through various workflows. The workflows are seen as functions and events that are connected by different teams or people, as well as tasks that allow business processes to be executed. The best thing about this type of enterprise modelling is that creating an EPC diagram is quick and simple as long as you have the proper tool. One of the main usages of the EPC diagrams is in the modelling, analyzing and re-engineering of business processes. With the use of the flowchart, businesses are able to see inefficiencies in the processes and modify to make them more productive. Event-driven process chain diagrams are also used to configure an enterprise resource plaSeven Basic Tools of Quality - Flow Chart
ConceptDraw DIAGRAM diagramming and vector drawing software offers a powerful Seven Basic Tools of Quality solution from the Quality area of ConceptDraw Solution Park which contains a set of useful tools for easy drawing Flow Chart of any complexity.Diagramming Software for Design UML Interaction Overview Diagrams
UML Interaction Overview Diagram schematically shows a control flow with nodes and a sequence of activities that can contain interaction or sequence diagrams.
The Best Tool for Business Process Modeling
The EPC diagram shows various business processes in terms of work flows. Event-Driven Process chain Diagrams for improvement throughout an organisation. ConceptDraw DIAGRAM - business process mapping software that reduces the time needed to create a business process model and is excellent business process improvement tools.Interaction Overview Diagram
UML Interaction Overview Diagram schematically shows a control flow with nodes and a sequence of activities that can contain interaction or sequence diagrams.
UML Block Diagram
Use Case Diagram Taxi Service UML. This sample was created in ConceptDraw DIAGRAM diagramming and vector drawing software using the UML Use Case Diagram library of the Rapid UML Solution from the Software Development area of ConceptDraw Solution Park. This sample shows the work of the taxi service and is used by taxi stations, by airports, in the tourism field and delivery service.Diagramming Software for Design UML Object Diagrams
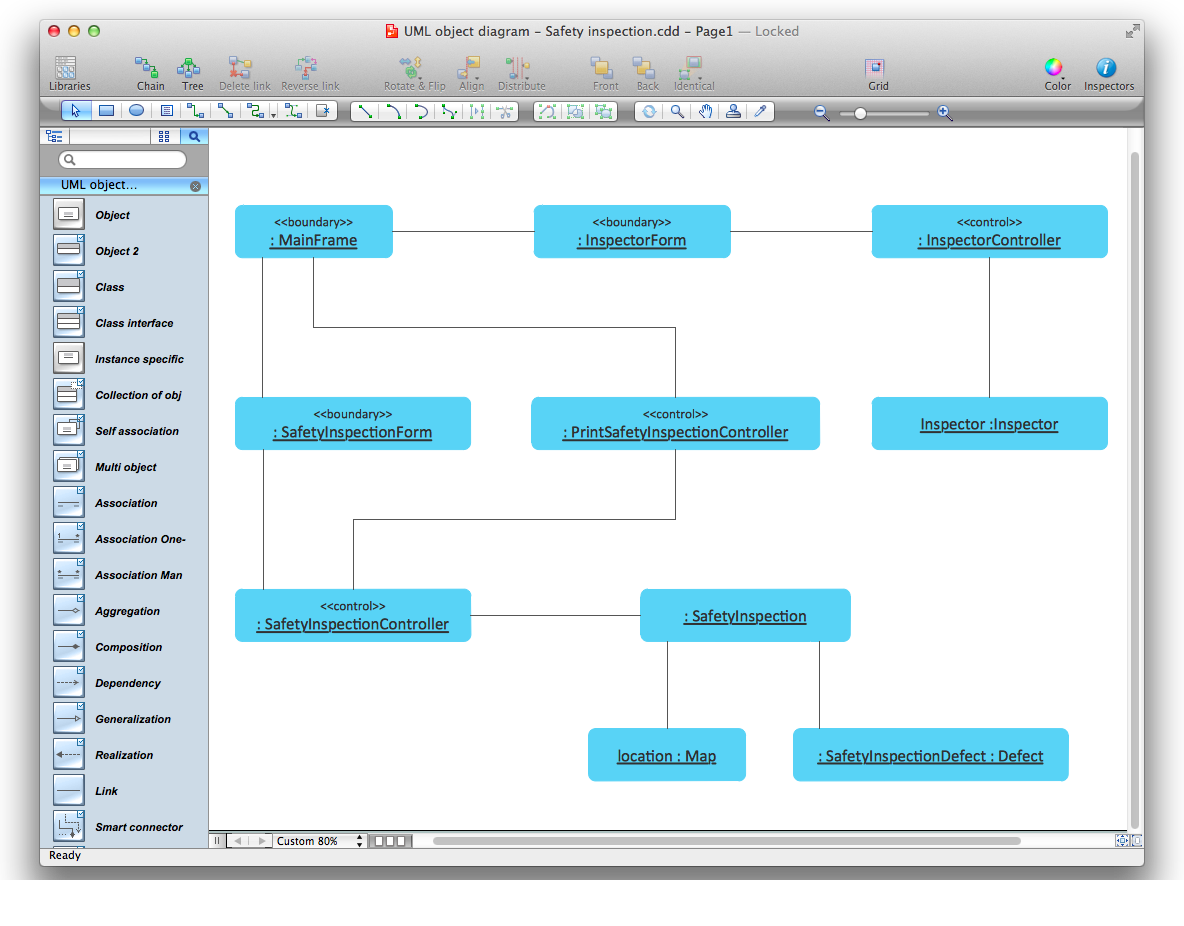
UML Object Diagram shows the structure of a modeled system at a specific time. ConceptDraw Rapid UML solution delivers libraries contain pre-designed objects fit UML notation, and ready to draw professional UML Object Diagram.
Process Flow Diagram
A Process Flow Diagram (PFD) is a diagram which shows the relationships between the main components in a system. Process Flow Diagrams are widely used by engineers in chemical and process engineering, they allows to indicate the general flow of plant process streams and equipment, helps to design the petroleum refineries, petrochemical and chemical plants, natural gas processing plants, and many other industrial facilities. ConceptDraw DIAGRAM diagramming and vector drawing software extended with powerful tools of Flowcharts Solution from the "Diagrams" Area of ConceptDraw Solution Park is effective for drawing: Process Flow Diagram, Flow Process Diagram, Business Process Flow Diagrams.Quality Control Chart Software — ISO Flowcharting
Quality Control Chart Software (ISO Flowcharting) - ConceptDraw DIAGRAM extended with Total Quality Management TQM Diagrams Solution from the Quality Management Area is the best diagramming and vector drawing software that allows you to draw the quality control charts quick and easy. The quality control chart is a graphic that illustrates the accordance of processes or products to the intended specifications and degree of differences from them. Depending on what type of data you need analyze, there are used different types of quality control charts: X-bar charts, S charts, Np charts.Control and Information Architecture Diagrams (CIAD) with ConceptDraw DIAGRAM
One of the three main constituents of any enterprise is the Control and Information Architecture. The rest two are Production facilities and People and Organization.UML Interaction Overview Diagram. Design Elements
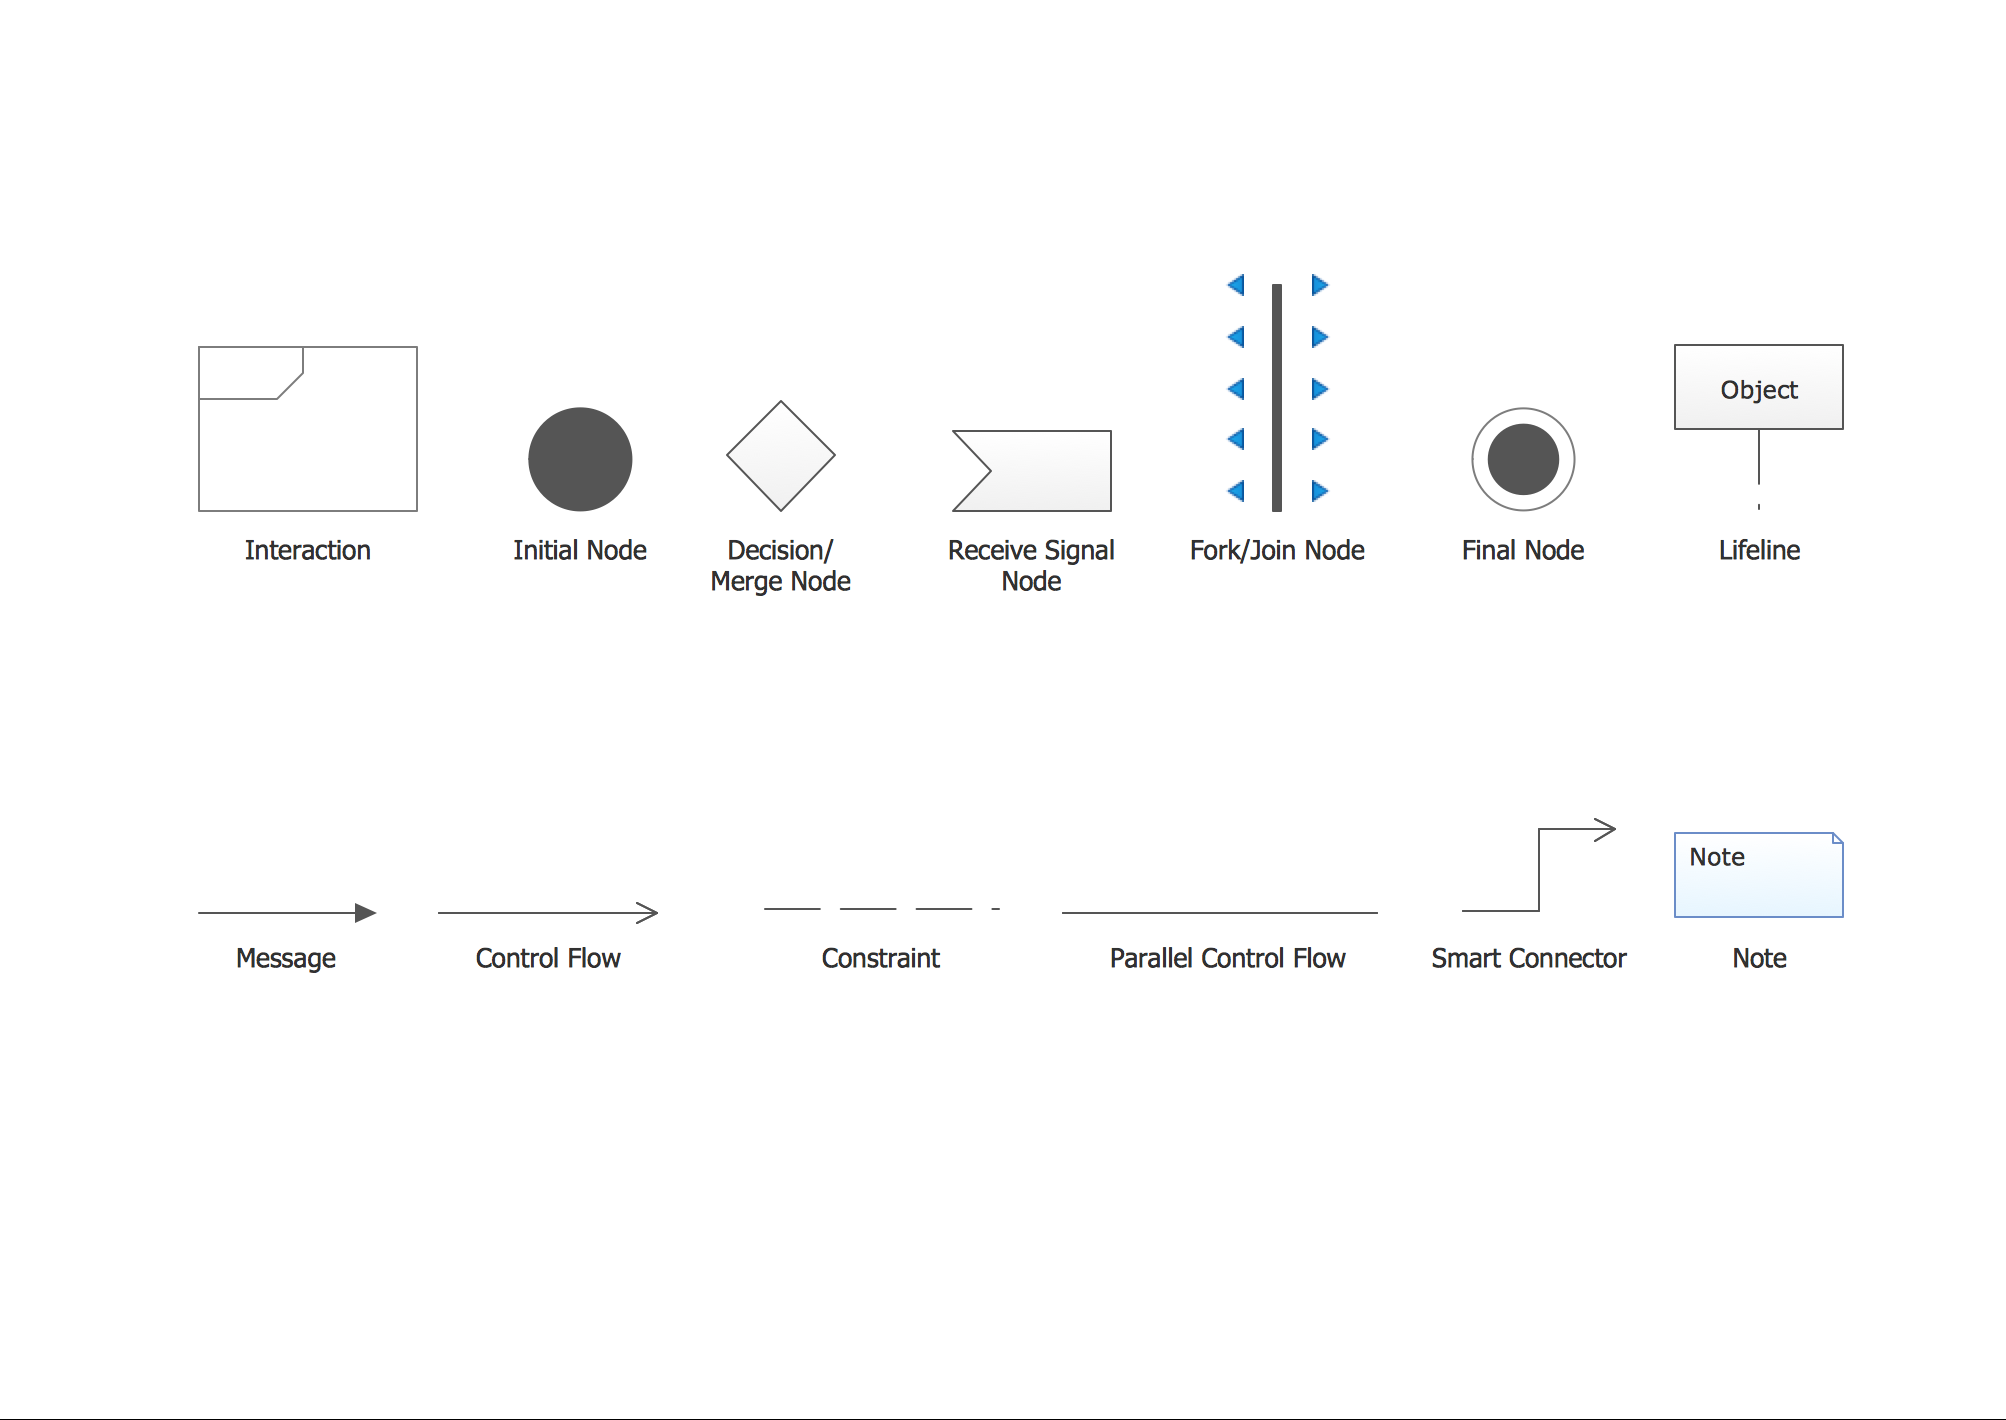
UML Interaction Overview Diagram schematically shows a control flow with nodes and a sequence of activities that can contain interaction or sequence diagrams. ConceptDraw has 393 vector stencils in the 13 libraries that helps you to start using software for designing your own UML Diagrams. You can use the appropriate stencils of UML notation from UML Interaction Overview library.UML Activity Diagram. Design Elements
UML Activity Diagram illustrate the business and operational step-by-step workflow of components in a system and shows the overall flow of control.
Flow chart Example. Warehouse Flowchart
Warehouse Flowcharts are various diagrams that describe the warehousing and inventory management processes on the warehouses. Typical purposes of Warehouse Flowcharts are evaluating warehouse performance, measuring efficiency of customer service and organizational performance. This type of Workflow diagrams can be used for identifying any disconnection between business activities and business objectives. They are effectively used by warehouse-related people and organizations, manufacturers, wholesalers, exporters, importers, transporters, and others. Standard Warehousing process flow diagram and standard Workflow diagram are used for process identification for further evaluating effectiveness and profitability of overall business process. Use the ConceptDraw DIAGRAM ector graphic software extended with Flowcharts solution to design your own professional-looking Workflow diagrams and Flowcharts of any types, including the Warehouse flowchart, Process flow diagrams which depict in details all steps of Warehouse packages flow. Microsoft Visio, designed for Windows users, can’t be opened directly on Mac. But fortunately, there are several Visio alternatives for Mac which will help Mac users to work Visio files. With ConceptDraw DIAGRAM , you may open, edit and save files in Visio format.
Flow Chart Symbols
The Flowcharts are incredibly useful and popular tool used in science, business, software development, analytics, engineering, marketing, manufacturing, administration, architecture, government, politics, and many other fields thanks to a variety of existing types of flowcharts. A Flowchart is a visual graphical representation of the process, algorithm, or the set of steps taken for problem's solution. Widely used for designing, visualizing and documenting simple and complex processes and programs, they effectively help to understand the process and to find easier the flaws if they are. Each flowchart type supposes the use of its own set of notations for drawing corresponding diagram, which includes the symbols of process, decision, data, document, data base, termination, initiation processes, processing loops, conditions, etc. It is easily design a Flowchart using the special professional flowchart maker - ConceptDraw DIAGRAM diagram software with numerous predesigned flow chart symbols grouped in libraries of Flowcharts solution from ConceptDraw Solution Park.- Control flow diagram
- Creating Control Flow Modelling In Software Engineering
- Control Flow Diagram Symbols
- Control Flow Diagram Banking System
- Design elements - Control flow diagram | Business process Flow ...
- Control Flow Diagram For Event Management
- Software Development Flow Diagram
- Stock Control Process Flow Chart
- UML Diagram | Process Flowchart | UML Activity Diagram | Control ...
- TQM Diagram Example | Process Flowchart | Quality Control Chart ...
- Control Flow Diagram For Library Management System
- Control Flow
- Process Flowchart | TQM Software — Build Professional TQM ...
- Control Flow Diagram Of Hospital Management System Wikipedia
- Event-driven Process Chain (EPC) Diagram Software | Control and ...
- Process Flowchart | TQM Diagram Example | Definition TQM ...
- Process Flowchart | Software development with ConceptDraw PRO ...
- System Flow Diagram Of Banking System On Software Engineering
- Logistics Flow Charts | Internal Control Flow Chart Of Pldt
- Basic Flowchart Symbols and Meaning | Audit Flowchart Symbols ...


