Diagramming Software for Design UML Interaction Overview Diagrams
UML Interaction Overview Diagram schematically shows a control flow with nodes and a sequence of activities that can contain interaction or sequence diagrams.
Interaction Overview Diagram
UML Interaction Overview Diagram schematically shows a control flow with nodes and a sequence of activities that can contain interaction or sequence diagrams.
UML Package Diagram. Design Elements
UML Package Diagram illustrates the functionality of a software system. ConceptDraw has 393 vector stencils in the 13 libraries that helps you to start using software for designing your own UML Diagrams. You can use the appropriate stencils of UML notation from UML Package library.
 Classic Business Process Modeling
Management Consultant
A management consultant is an important person for the company, he helps in the questions of improving business performance and increasing profits, he consults for the questions of business strategy, management and financial controls, resources, and also suggests recommendations for changing the structure of the company if needed.
So, every day management consultant conduct the complex work and often use the helpful management infographics for explain his thoughts and arguments to the company direction. Thanks to the development of computer technologies, drawing of management infographics is so easy today. ConceptDraw DIAGRAM diagramming and vector drawing software offers you the Management Infographics Solution from the Business Infographics Area.
Process Flow Chart Symbol
Process Flow Charts are very popular and widely used in chemical and process engineering for representation a general flow of plant processes and equipment. If you need often draw them, the ConceptDraw DIAGRAM diagramming and vector drawing software extended with tools of Flowcharts Solution will be useful for you. The mostly used set of process flow chart symbols includes the following: Rectangle (box) process flow chart symbol, Rounded rectangle, Circle, Diamond.Data Flow Diagrams
Data Flow Diagram (DFD) is a special chart type which lets graphically illustrate the "flow" of data through an information system. So the Data Flow Diagrams can be successfully used for visualization of data processing or structured design, for creation an overview of the system, for business process modeling, for exploring the high-level design in terms of data flows and documenting the major data flows. Inclusion of powerful Data Flow Diagrams solution to the Software Development area of ConceptDraw Solution Park makes the ConceptDraw DIAGRAM a beneficial data flow diagramming software and supplies it with numerous collection of quick-start templates, professionaly designed samples, and extensive range of ready-for-use vector objects consisting the Data Flow Diagrams, Gane-Sarson Notation, and Yourdon and Coad Notation libraries. Use the ConceptDraw DIAGRAM application to design easy and quickly the Data Flow Diagrams including the data storages, data flows, external entities, functional transforms, control transforms and signals.
 Jackson Structured Programming (JSP) Diagrams
Quality Control Chart Software — ISO Flowcharting
Quality Control Chart Software (ISO Flowcharting) - ConceptDraw DIAGRAM extended with Total Quality Management TQM Diagrams Solution from the Quality Management Area is the best diagramming and vector drawing software that allows you to draw the quality control charts quick and easy. The quality control chart is a graphic that illustrates the accordance of processes or products to the intended specifications and degree of differences from them. Depending on what type of data you need analyze, there are used different types of quality control charts: X-bar charts, S charts, Np charts.Model Based Systems Engineering
ConceptDraw DIAGRAM is a professional diagramming and vector drawing software. Now, enhanced with SysML Solution from the Software Development Area of ConceptDraw Solution Park, ConceptDraw DIAGRAM became an ideal software for model based systems engineering (MBSE).Model Based Systems Engineering
ConceptDraw DIAGRAM is a professional diagramming and vector drawing software. Now, enhanced with SysML Solution from the Software Development Area of ConceptDraw Solution Park, ConceptDraw DIAGRAM became an ideal software for model based systems engineering (MBSE).DFD Library — Design elements
Data Flow Diagrams (DFD) solution from the Software Development area of ConceptDraw Solution Park provides plenty of predesigned templates, samples and DFD vector design elements proposed by three DFD libraries. These DFD library objects are designed to help you effectively model the data flows and functional requirements for the business processes or systems, to design the Process-oriented models or Data-oriented models, Data flowcharts and Data process diagrams, Structured analysis diagrams and Information flow diagrams. There are two different notations used to draw the Data Flow Diagrams (Yourdon & Coad and Gane & Sarson). These notations define the different visual representations for the processes, data stores, data flows, and external entities. ConceptDraw DIAGRAM software provides you with possibility of designing professional-looking Data Flow Diagrams, DFD Models, Data Flow Process Diagrams using any of these notations. Simply drag the predesigned DFD flowchart symbols from the appropriate library and connect by arrows depicting the data flow from one step to another.Data Flow Diagrams
The information system manages the flow of data introduced into the system. To graphically represent and document the flow of data through some information system is used a Data Flow Diagram (DFD). DFD is a way to visualize the flow of data or data processing, to clearly demonstrate what type of data or information is transferred, where they come from and where are sent. It lets to create an overview of the system, to depict the major steps, and effectively model the processes. DFDs are helpful for analyzing and modifying the business systems. Traditionally are used two notations for DFDs creation - Yourdon-Coad and Gane-Sarson. ConceptDraw DIAGRAM software offers a special Data Flow Diagrams solution from Software Development area, which enables to quickly and simply create professional Data Flow Diagrams including the data storage, data flows, external entities, functional transforms, control transforms and signals. Use the offered templates, samples and extensive range of libraries to design your own Data Flow Diagrams in minutes.Social Media Response DFD Flowcharts - diagramming software ( Mac PC )
Diagramming software for Mac and PC - create flowcharts and presentations for Social Media Organizing.
Flow Chart Symbols
The Flowcharts are incredibly useful and popular tool used in science, business, software development, analytics, engineering, marketing, manufacturing, administration, architecture, government, politics, and many other fields thanks to a variety of existing types of flowcharts. A Flowchart is a visual graphical representation of the process, algorithm, or the set of steps taken for problem's solution. Widely used for designing, visualizing and documenting simple and complex processes and programs, they effectively help to understand the process and to find easier the flaws if they are. Each flowchart type supposes the use of its own set of notations for drawing corresponding diagram, which includes the symbols of process, decision, data, document, data base, termination, initiation processes, processing loops, conditions, etc. It is easily design a Flowchart using the special professional flowchart maker - ConceptDraw DIAGRAM diagram software with numerous predesigned flow chart symbols grouped in libraries of Flowcharts solution from ConceptDraw Solution Park.Audit Flowchart Symbols
The audit is a complex process consisting of defined quantity of steps, which have as a final goal the ensuring of success of a certain business project. It includes the independent examination of data, statements and financial performances of an enterprise for a stated purpose. It is convenient to construct the Audit Flowcharts or Audit Diagrams for visual representation and structuring the audit processes. ConceptDraw DIAGRAM diagramming software enhanced with Audit Flowcharts solution from the Finance and Accounting area of ConceptDraw Solution Park effectively helps to draw the Audit Diagrams for accounting, finance and money management, the Audit Flowcharts for fiscal information tracking, financial inventories and documenting Six Sigma, the decision making Flow Charts, etc. This solution provides the powerful drawing tools, numerous templates and samples, and large quantity of vector audit flowchart symbols that greatly facilitate the process of representation the audit steps and audit results, and designing efficient and visually appealing Audit Flowcharts.Scrum
What is Scrum? Scrum is the famous agile software development methodology which depicts an iterative and incremental approach for the work on the complex projects. Use ConceptDraw DIAGRAM diagramming and vector drawing software extended with SCRUM Workflow solution to draw various types of professional-looking Scrum Charts, Scrum Workflow Diagrams, Scrum Mind Maps, Scrum boards and attractive Scrum Infographics.Program to Make Flow Chart
Use ConceptDraw DIAGRAM diagramming and business graphics software for drawing your own PM life cycle flow charts.Workflow Diagram Symbols
Workflow Diagram is an acknowledged method of drawing the processes and business processes, which uses the concerted set of symbols for depicting different kinds of steps or relations. Often it is named the Process Flow Diagram, but the real Process Flow Diagram uses different visual notations and different flowchart symbols. The professionally designed Workflow diagram also may be used for the same purpose as a Critical process flow diagram. Nevertheless, there are many cases when you may need to make your Workflow Diagram more bright and graphic. ConceptDraw DIAGRAM diagramming software extended with Workflow Diagrams solution from Business Processes area of ConceptDraw Solution Park possesses the powerful properties of software for Workflow diagram design. It delivers rich set of business process workflow diagram symbols, which help users to accurately diagram the workflow scenarios and to design great-looking and attractive Workflow Diagrams and Process Flow Diagrams better-suited for presentations, websites, reports, and other documents.Bank Sequence Diagram
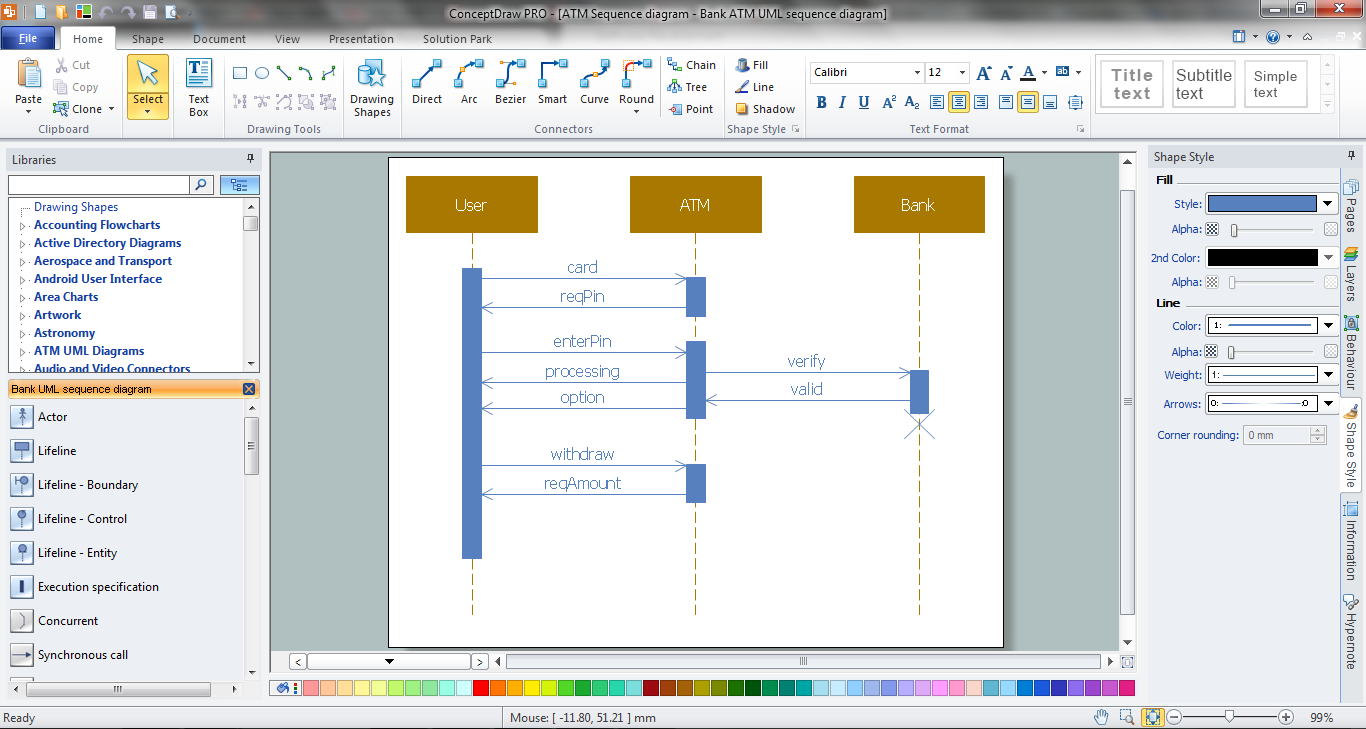
ConceptDraw DIAGRAM diagramming and vector drawing software enhanced with ATM UML Diagrams Solution from the Software Development Area of ConceptDraw Solution Park is a perfect tool for fast and easy creating the Bank Sequence Diagram.- Control Flow Diagram For Library Management System
- Control flow diagram
- Data Flow Diagram For Library Management System Ppt
- Data Flow Diagram Of Library Management System Pdf
- Data Flow Diagram Symbols. DFD Library
- Library Management System Documentation Pdf
- Design elements - Control flow diagram | Business process Flow ...
- Control Flow
- Rapid UML | Interaction Overview Diagram For Library Management ...
- Activity Diagram For Library Management System In Uml
- Did Diagram Library Management System
- Dfd For Library Management System Ppt
- DFD Library System | Data Flow Diagrams (DFD) | Management ...
- ATM UML Diagrams | Control Flow Graph For Atm Withdrawal System
- Data Flow Diagram Symbols. DFD Library | Example of DFD for ...
- UML Activity Diagram | Diagramming Software for Design UML ...
- Uml Diagrams For Library Management System Doc
- Object Diagram For Library Management System Ppt
- Dfd 0 Diagram For Library Management System
- Object Diagram Of Library Management System


