Bubble diagrams in Landscape Design with ConceptDraw DIAGRAM
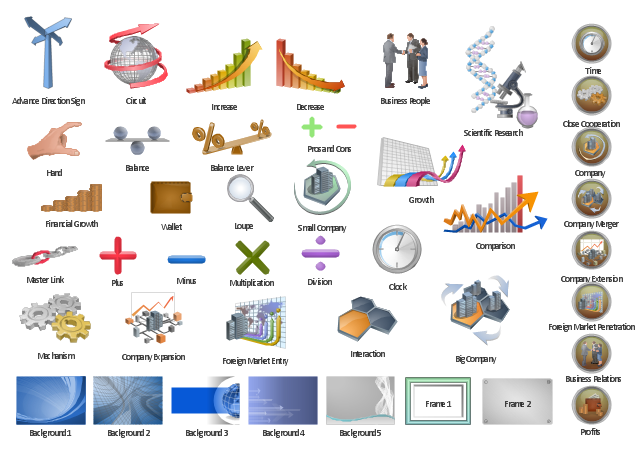
Bubble Diagrams are the charts with a bubble presentation of data with obligatory consideration of bubble's sizes. They are analogs of Mind Maps and find their application at many fields, and even in landscape design. At this case the bubbles are applied to illustrate the arrangement of different areas of future landscape design, such as lawns, flowerbeds, playgrounds, pools, recreation areas, etc. Bubble Diagram helps to see instantly the whole project, it is easy for design and quite informative, in most cases it reflects all needed information. Often Bubble Diagram is used as a draft for the future landscape project, on the first stage of its design, and in case of approval of chosen design concept is created advanced detailed landscape plan with specification of plants and used materials. Creation of Bubble Diagrams for landscape in ConceptDraw DIAGRAM software is an easy task thanks to the Bubble Diagrams solution from "Diagrams" area. You can use the ready scanned location plan as the base or create it easy using the special ConceptDraw libraries and templates.The vector clipart library "Presentation" design elements contains 45 symbols you can use to design your presentation slides and illustrations using the ConceptDraw PRO diagramming and vector drawing software.
"Although some think of presentations in a business meeting context, there are often occasions when that is not the case. For example, a non-profit organization presents the need for a capital fund-raising campaign to benefit the victims of a recent tragedy; a school district superintendent presents a program to parents about the introduction of foreign-language instruction in the elementary schools;an artist demonstrates decorative painting techniques to a group of interior designers; a horticulturist shows garden club members or homeowners how they might use native plants in the suburban landscape; a police officer addresses a neighborhood association about initiating a safety program. ...
A study done by Wharton School Of Business showed that the use of visuals reduced meeting times by 28 percent. Another study found that audiences believe presenters who use visuals are more professional and credible than presenters who merely speak. Other research indicates that meetings and presentations reinforced with visuals help participants reach decisions and consensus more quickly." [Presentation. Wikipedia]
The clip art example "Design elements - Presentation symbols" is included in the Presentation Clipart solution from the Illustration area of ConceptDraw Solution Park.
HelpDesk
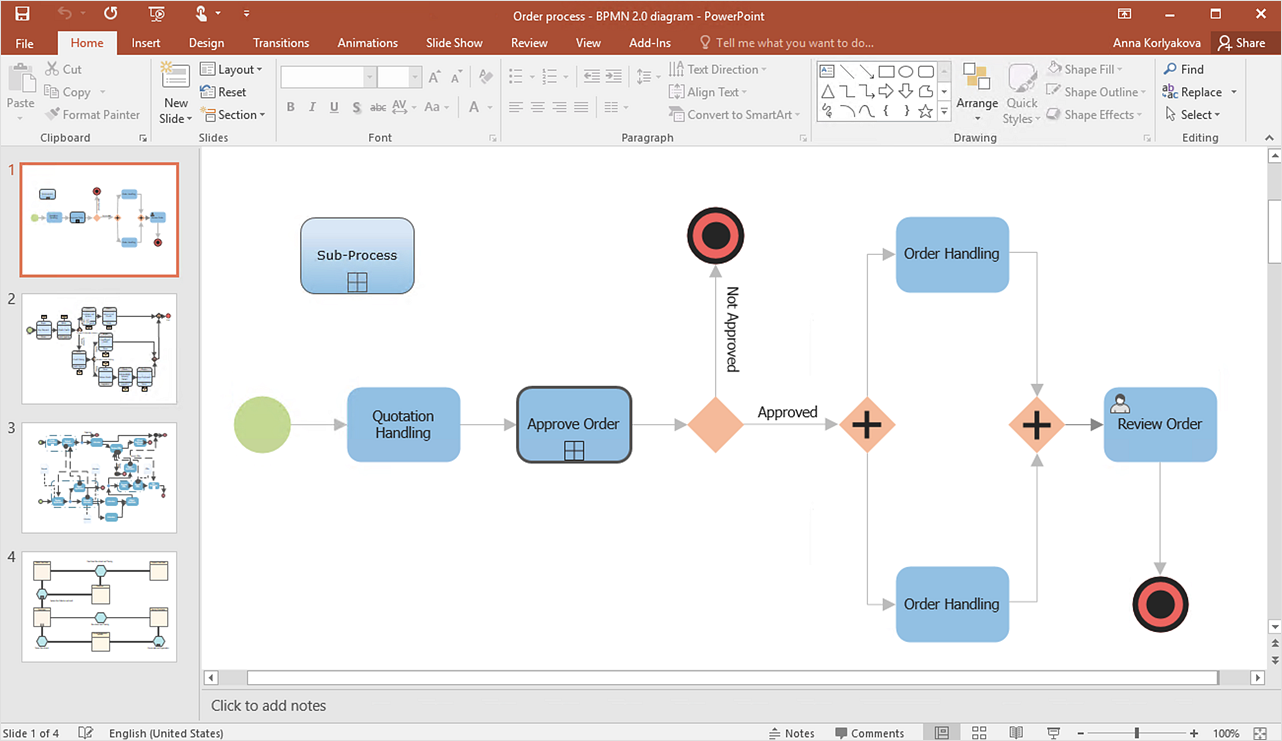
How To Present a Business Process Model
The most effective way of organizing and modeling a business process is to use a visual format. The visual approach to a business process modeling or analizing enables each point to be displayed clearly and compendiously. To reach the professional norms necessary for business process diagrams, it's better to use ConceptDraw Business Process Mapping solution. It delivers an extensive choice of process mapping tools to help quality management and help improve business workflows. The export facilities of ConceptDraw DIAGRAM help make short work of presenting the business process model by export business process diagrams to MS PowerPoint.- Conventional Symbols In Landscape Design
- Conventional Symbols Engineering Drawings
- Signs And Symbols For Landscaping
- Landscape Architecture Drawing Symbols
- Building Drawing Conventional Symbols Pdf
- Conventional Symbols For Architecture
- Signs And Symbols Used In Landscaping
- Symbols Drawings For Landscaping From An Architect Designer
- Conventional Representation Symbols Used In Engineering
- Draw 5o Conventional Sign And Symbol Use On Map
- How To use Furniture Symbols for Drawing Building Plan | How to ...
- Design elements - Presentation symbols | Event-driven Process ...
- Landscape Architecture Plants
- Conventional Sign And Symbols In Building Planning
- Architecture Symbols For Landscape
- Building Plans with ConceptDraw PRO | Landscape Plan ...
- Basic Flowchart Symbols and Meaning | Bubble diagrams in ...
- Bubble diagrams in Landscape Design with ConceptDraw PRO ...
- Basic Flowchart Symbols and Meaning | Bubble diagrams in ...
- Design elements - Presentation symbols | Healthy Food Recipes ...


