How to Discover Critical Path on a Gantt Chart

PERT Chart Software
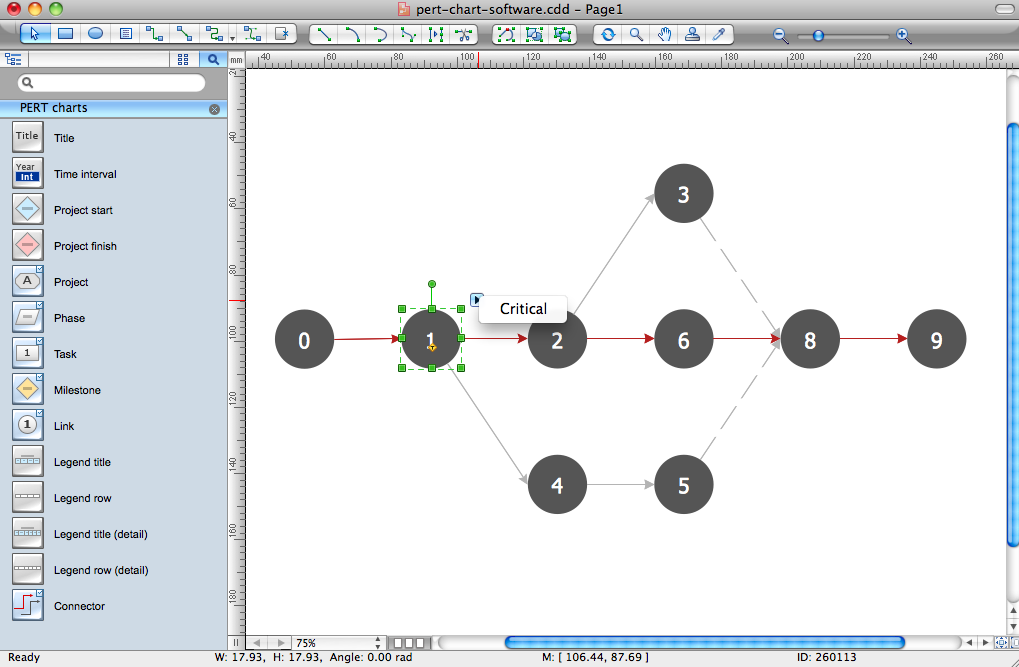
Program Evaluation and Review Technique (PERT) with ConceptDraw DIAGRAM

Activity Network (PERT) Chart

Gantt charts for planning and scheduling projects

How to Create Gantt Chart

Program Evaluation and Review Technique (PERT) with ConceptDraw DIAGRAM
How to Report Task's Execution with Gantt Chart

Project — Working With Tasks

HelpDesk
How to Create Project Diagrams on PC

- Gantt Chart To Pert Chart Converter
- Convert Gantt Chart To Pert Chart
- Gantt Chart Pert Chart Flow Chart Pdf
- Gantt Pert Chart Difference
- What Is The Difference Between A Gantt Chart And Critical Analysis
- Example Discussion In Gantt Chart
- Project Scheduling Using Pert And Gantt Chart In Software
- How to Make a Mind Map from a Project Gantt Chart | How to Quickly ...
- How To Convert a Computer Network Diagram to Adobe PDF Using ...
- Gantt Chart And Pert Chart In Software Engineering With Example