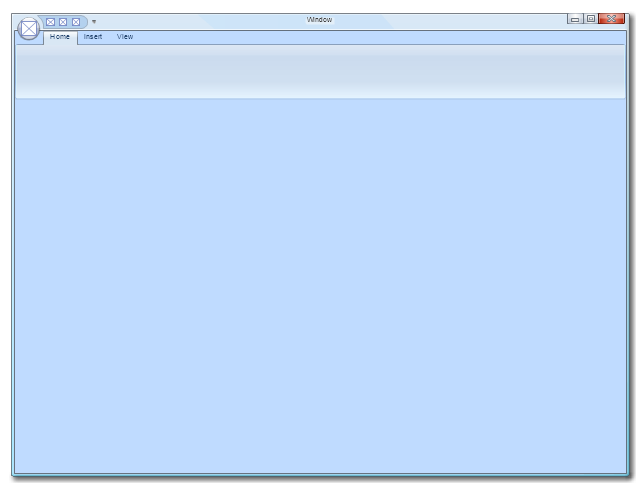
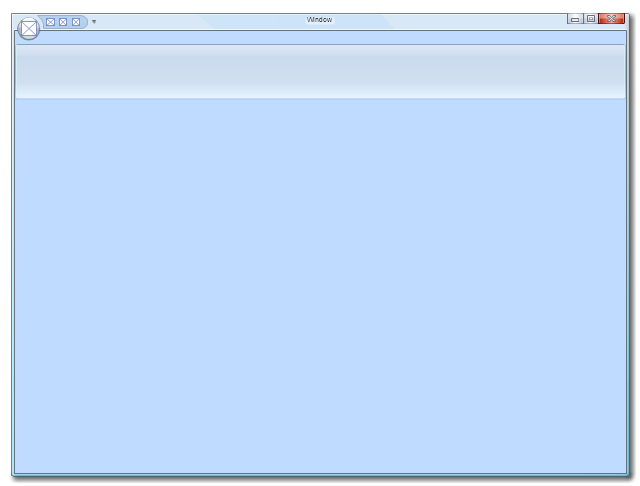
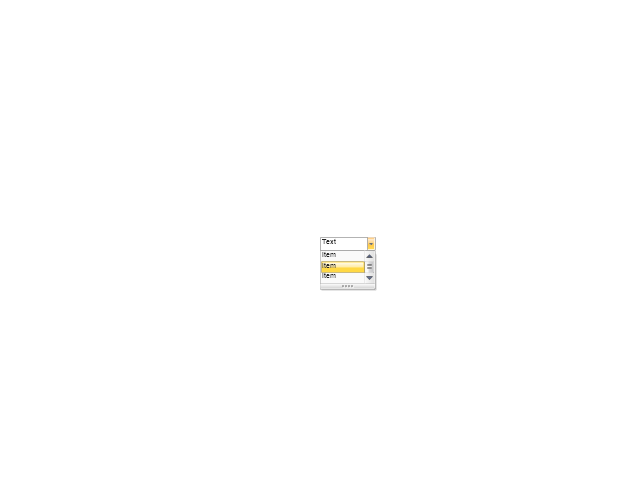
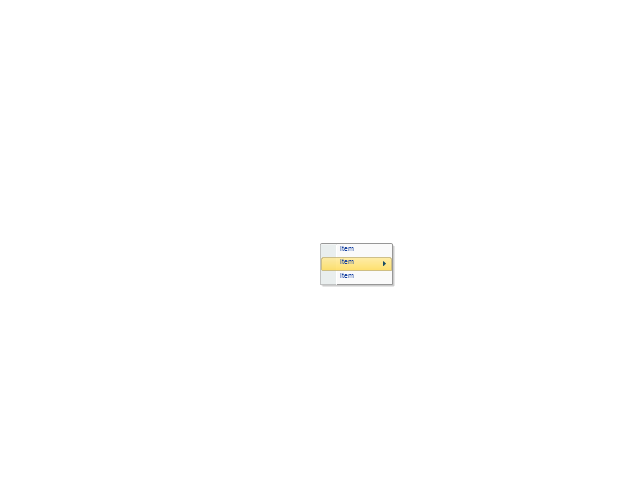
The vector stencils library "Ribbon interface" contains 41 ribbon shapes.
Use it for designing Microsoft ribbon graphic user interface (GUI) of software for Windows computers in the ConceptDraw PRO diagramming and vector drawing software extended with the Graphic User Interface solution from the Software Development area of ConceptDraw Solution Park.
Use it for designing Microsoft ribbon graphic user interface (GUI) of software for Windows computers in the ConceptDraw PRO diagramming and vector drawing software extended with the Graphic User Interface solution from the Software Development area of ConceptDraw Solution Park.
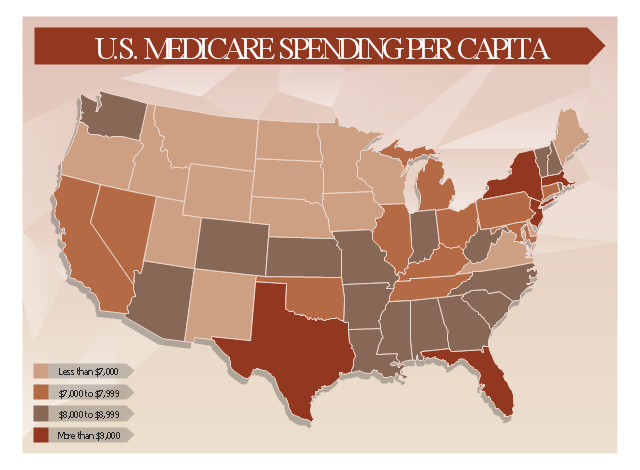
This healthcare economics infogram example was redesigned from the Wikimedia Commons file: Medicare spending per capita.png.
"Research by The Dartmouth Institute for Health Policy and Clinical Practice in the Dartmouth Atlas showed that in 2006, Medicare spending varied significantly by state. Other research quoted by the CEA Report indicated that up to 30% of Medicare costs could be saved if the middle- and high-cost states spent at the level of the lower-cost states.[1] Bear in mind that this is a Medicare comparison, so all the persons in the population analyzed are over 65.
References:
1. White House Council of Economic Advisors (CEA)-The Economic Case for Health Care Reform-June 2009-Page 19."
[commons.wikimedia.org/ wiki/ File:Medicare_ spending_ per_ capita.png]
The healthcare management thematic map sample "U.S. Medicare spending per capita" was created using the ConceptDraw PRO diagramming and vector drawing software extended with the Management Infographics solition from the area "Business Infographics" in ConceptDraw Solution Park.
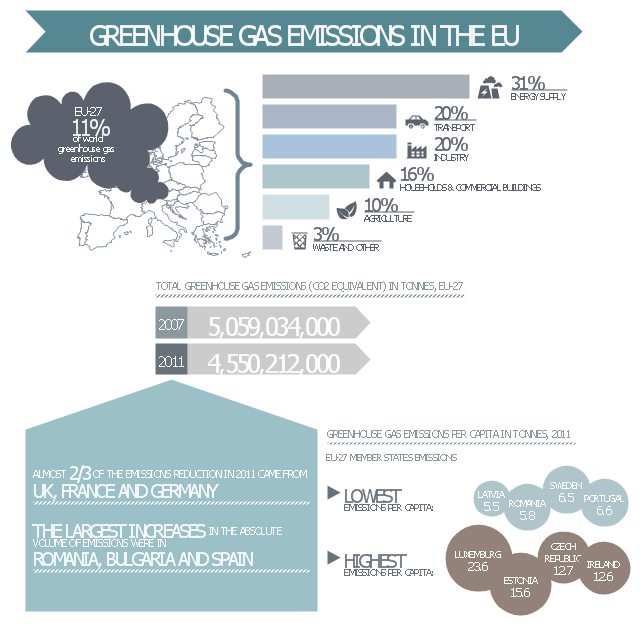
This ecology infographic example was created on the base of the infographics "Greenhouse gas emissions in the EU" from the Debating Europe website. [debatingeurope.eu/ wp-content/ uploads/ 2013/ 06/ TH_ 2_ social.png]
"A greenhouse gas (sometimes abbreviated GHG) is a gas in an atmosphere that absorbs and emits radiation within the thermal infrared range. This process is the fundamental cause of the greenhouse effect. The primary greenhouse gases in the Earth's atmosphere are water vapor, carbon dioxide, methane, nitrous oxide, and ozone. Greenhouse gases greatly affect the temperature of the Earth; without them, Earth's surface would average about 33 °C colder, which is about 59 °F below the present average of 14 °C (57 °F)." [Greenhouse gas. Wikipedia]
The ecology infographic example "EU greenhouse gas emissions" was created using the ConceptDraw PRO diagramming and vector drawing software extended with the Management Infographics solition from the area "Business Infographics" in ConceptDraw Solution Park.
Used Solutions
The vector stencils library "Management title blocks" contains 10 shapes: rectangle, rounded rectangle, ribbon, arrow, flag, bookmark.
Use it to design your management infogram.
The titles example "Design elements - Management title blocks" was created using the ConceptDraw PRO diagramming and vector drawing software extended with the Management Infographics solition from the area "Business Infographics" in ConceptDraw Solution Park.
How To Do A Mind Map In PowerPoint
ConceptDraw MINDMAP - an excellent tool for exporting mind maps to PowerPoint to visualize and presenting your project. You can simply generate, change, update your mindmap and then make a presentation in PowerPoint.The vector stencils library "Winter Olympics pictograms" contains 29 pictograms and silhouettes.
Use it for drawing Winter Olympics diagrams, infographics and illustrations in the ConceptDraw PRO diagramming and vector drawing software extended with the Winter Sports solution from the Sport area of ConceptDraw Solution Park.
Use it for drawing Winter Olympics diagrams, infographics and illustrations in the ConceptDraw PRO diagramming and vector drawing software extended with the Winter Sports solution from the Sport area of ConceptDraw Solution Park.
The vector stencils library "Winter Olympics pictograms" contains 29 pictograms and silhouettes.
Use it for drawing Winter Olympics diagrams, infographics and illustrations in the ConceptDraw PRO diagramming and vector drawing software extended with the Winter Sports solution from the Sport area of ConceptDraw Solution Park.
Use it for drawing Winter Olympics diagrams, infographics and illustrations in the ConceptDraw PRO diagramming and vector drawing software extended with the Winter Sports solution from the Sport area of ConceptDraw Solution Park.
The vector stencils library "Sales arrows" contains 57 arrow symbols.
Use these arrow icon set to draw your sales flowcharts, workflow diagrams and process charts with the ConceptDraw PRO diagramming and vector drawing software.
The arrow pictograms library "Sales arrows" is included in the Sales Flowcharts solution from the Marketing area of ConceptDraw Solution Park.
The vector stencils library "Medicine and health pictograms" contains 20 icons of medical and healthcare symbols.
Use it to draw your medical and healthcare infographics.
The example "Medicine and health pictograms - Vector stencils library" was created using the ConceptDraw PRO diagramming and vector drawing software extended with the Pictorial infographics solution from the area "What is infographics" in ConceptDraw Solution Park.
 Graphic User Interface
Graphic User Interface solution extends ConceptDraw PRO software with templates, samples and libraries of vector stencils for design of the GUI prototypes and diagrams for Windows, Mac OS and iOS software.
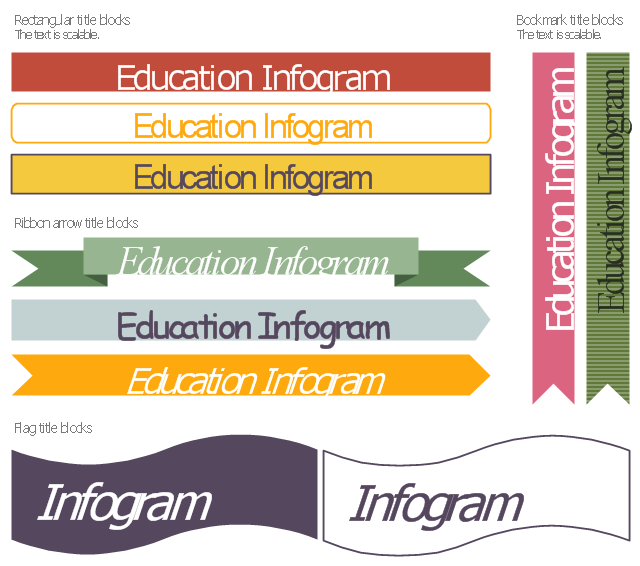
The vector stencils library "Education title blocks" contains 10 title block shapes: rectangular, arrow, ribbon, bookmark, flag.
Use these elements to design your educational infograms.
"The title of a book, or any other published text or work of art, is a name for the work which is usually chosen by the author. A title can be used to identify the work, to place it in context, to convey a minimal summary of its contents, and to pique the reader's curiosity." [Title (publishing). Wikipedia]
The shapes example "Design elements - Education title blocks" was created using the ConceptDraw PRO diagramming and vector drawing software extended with the Education Infographics solition from the area "Business Infographics" in ConceptDraw Solution Park.
HelpDesk
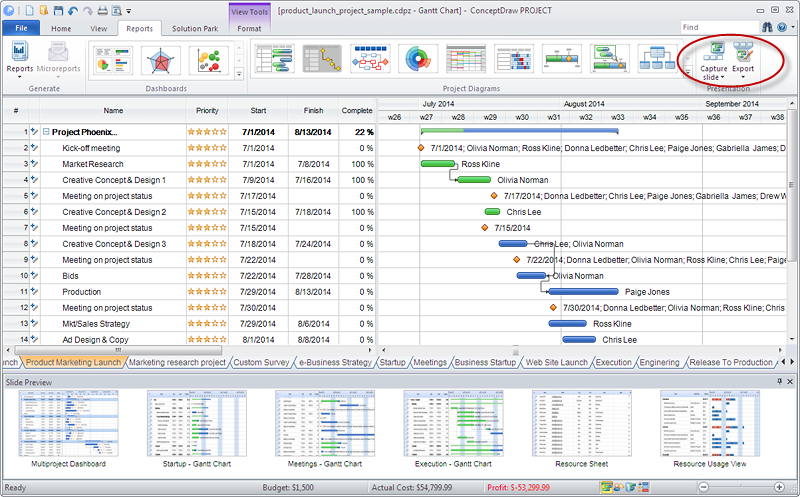
How to Get Images for Project Presentation on Windows
ConceptDraw PROJECT allows you to easily make slides for presentation.Sales Steps
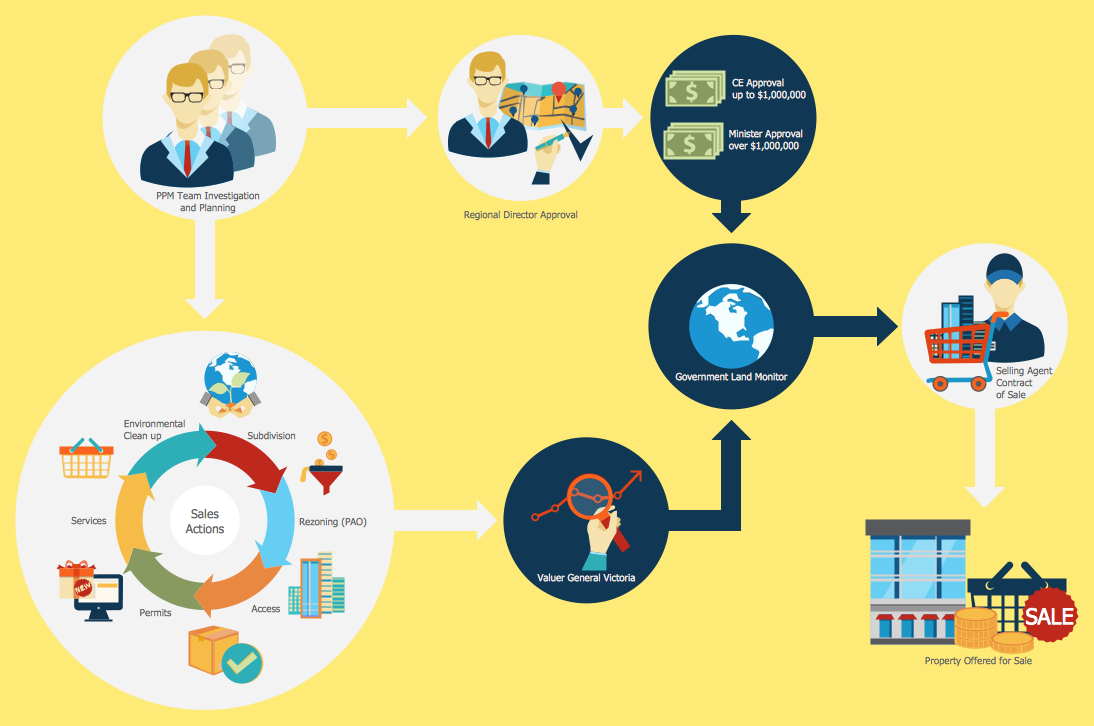
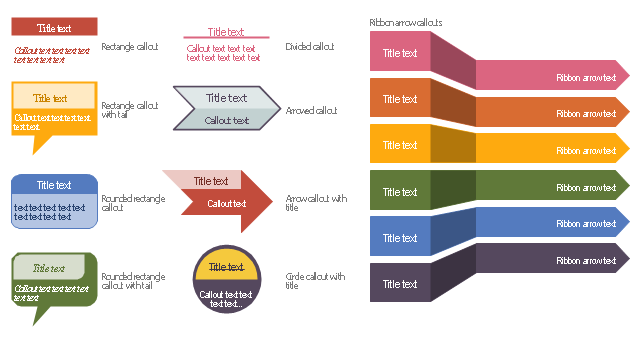
Helps to create professionally looking and detailed Sales Flowcharts with all sales steps visually represented on them. Use the Sales Flowcharts Solution for ConceptDraw PRO software to create your own Sales Flowcharts of any complexity quickly, easily and effectively to use them successfully in your work activity. ConceptDraw PRO diagramming and vector drawing software supplied with unique Sales Flowcharts solution from the Marketing area of ConceptDraw Solution Park allows fast and easy visualize all sales steps of the sales process on a sales process Map or sales process flowchart, and then realize them easily.The vector stencils library "Education titled callouts" contains 14 titled callout blocks.
Use it to design your educational infograms.
"In publishing, a call-out or callout is a short string of text connected by a line, arrow, or similar graphic to a feature of an illustration or technical drawing, and giving information about that feature. The term is also used to describe a short piece of text set in larger type than the rest of the page and intended to attract attention.
A similar device in word processing is a special text box with or without a small "tail" that can be pointed to different locations on a document." [Callout. Wikipedia]
The shapes example "Design elements - Education titled callouts" was created using the ConceptDraw PRO diagramming and vector drawing software extended with the Education Infographics solition from the area "Business Infographics" in ConceptDraw Solution Park.
How to Build a Flowchart
The ConceptDraw PRO is a professional software for quick creating great looking flowcharts. The vector stencils from object libraries allows you to use RapidDraw technology. By the clicking on direction arrows one can add new object to flowcharts. This technology gives to users the ability to fast creating visualization for the structural data. Learn the basics of flowcharting and see how to build create a flowchart using ConceptDraw automatic drawing tools.- Triangled End Ribbon Png
- Ribbon Png Tumblr
- Education pictograms - Vector stencils library | Flat Ribbon Design Png
- Ribbon interface - Vector stencils library | Minimize Button Rectangle ...
- Vector Ribbons Single Side White Png
- Light Green Corner Ribbon Png
- Title Ribbon Png
- HR arrows - Vector stencils library | Png Bullet Point Ribbon
- Windows 10 User Interface | Badges With Ribbon Png
- Shape Ribbon Png
- Ribbon Vector Png
- Ribbons Vector Png
- Ribbon Design Png
- Ribbon Banner Vector Png
- Ribbon Illustration Png
- Ribbon Gold Png
- Rectangular Ribbon Png
- Round Designer Ribbon Png
- Ribbon interface - Vector stencils library | Wireframe - Vector stencils ...
- Ribbon interface - Vector stencils library | General window elements ...




-ribbon-interface---vector-stencils-library.png--diagram-flowchart-example.png)





-ribbon-interface---vector-stencils-library.png--diagram-flowchart-example.png)
-ribbon-interface---vector-stencils-library.png--diagram-flowchart-example.png)
-ribbon-interface---vector-stencils-library.png--diagram-flowchart-example.png)


