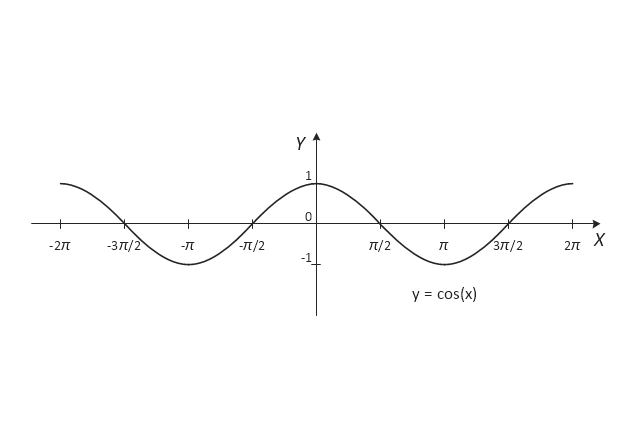
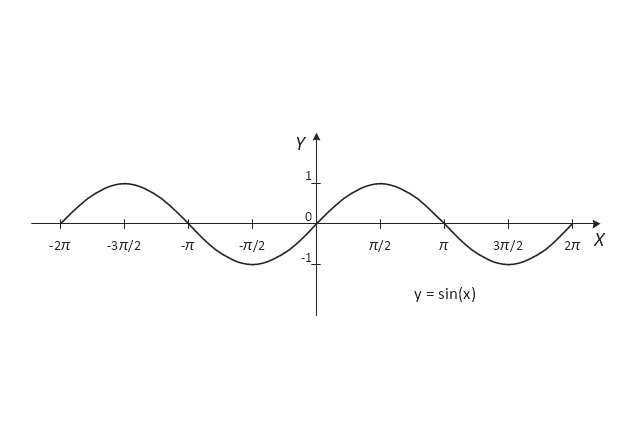
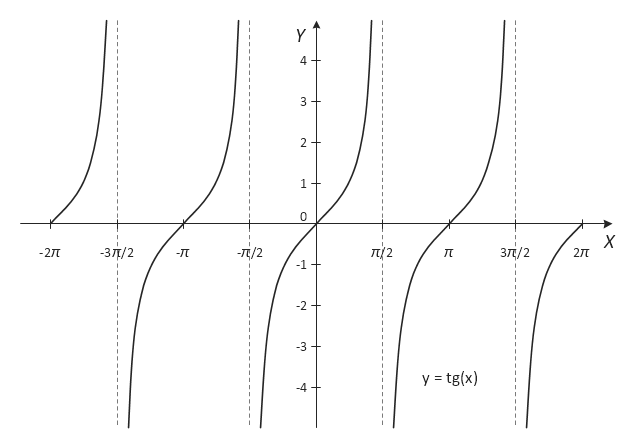
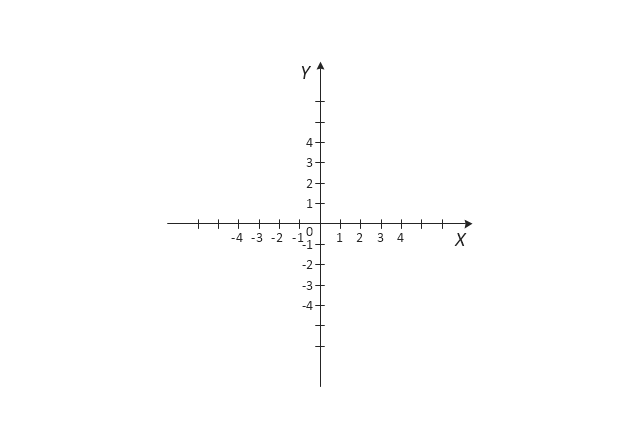
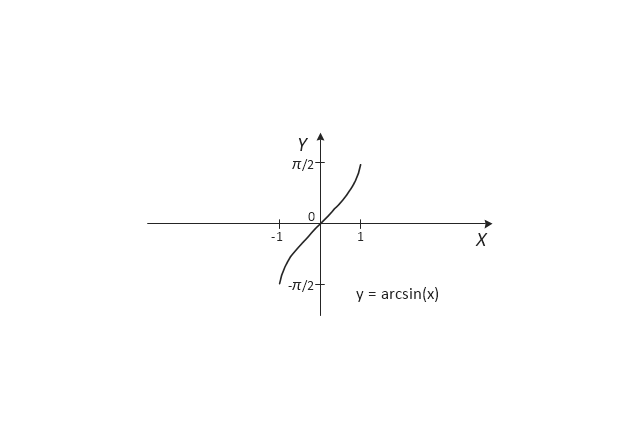
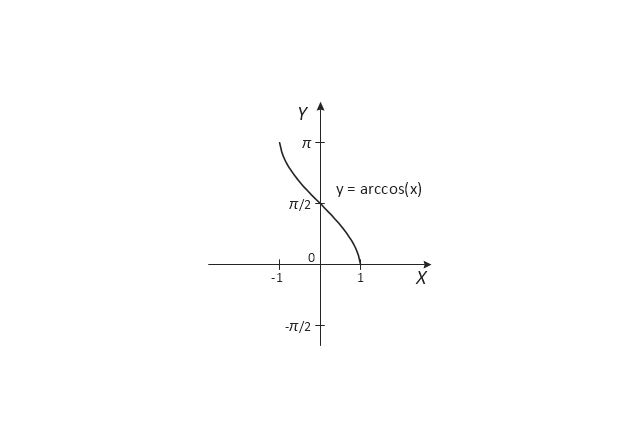
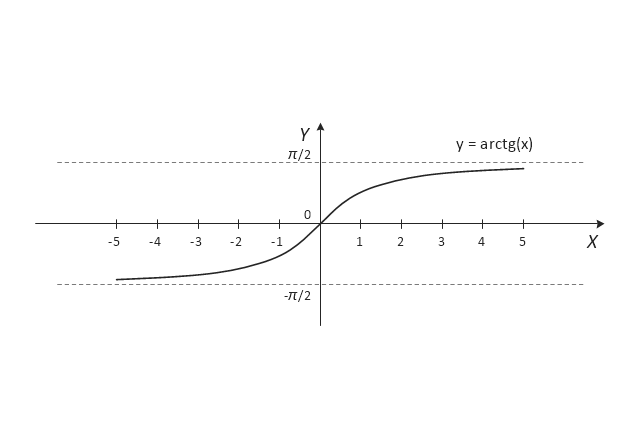
The vector stencils library "Trigonometric functions" contains 8 shapes of trigonometrical and inverse trigonometrical functions graphs: sine, cosine, tangent, arcsine, arccosine, arctangent, system axes.
Use these shapes to draw your geometrical diagrams and illustrations in the ConceptDraw PRO diagramming and vector drawing software extended with the Mathematics solution from the Science and Education area of ConceptDraw Solution Park.
Use these shapes to draw your geometrical diagrams and illustrations in the ConceptDraw PRO diagramming and vector drawing software extended with the Mathematics solution from the Science and Education area of ConceptDraw Solution Park.
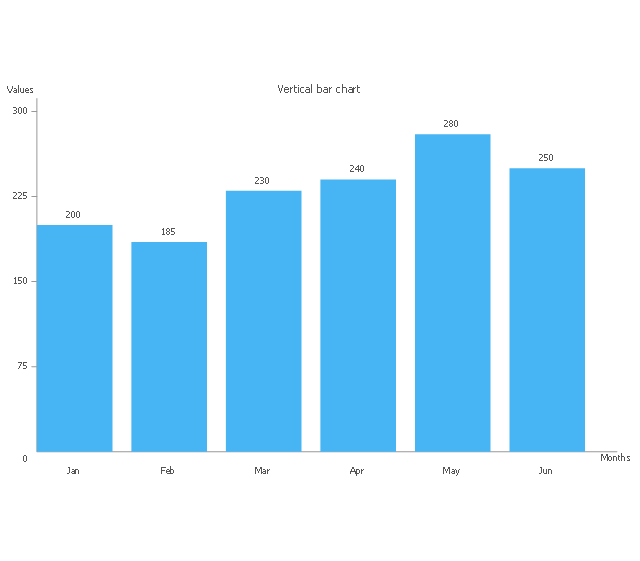
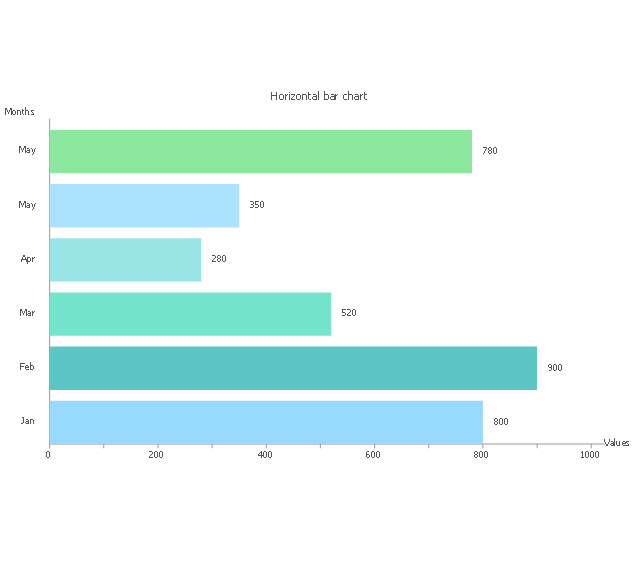
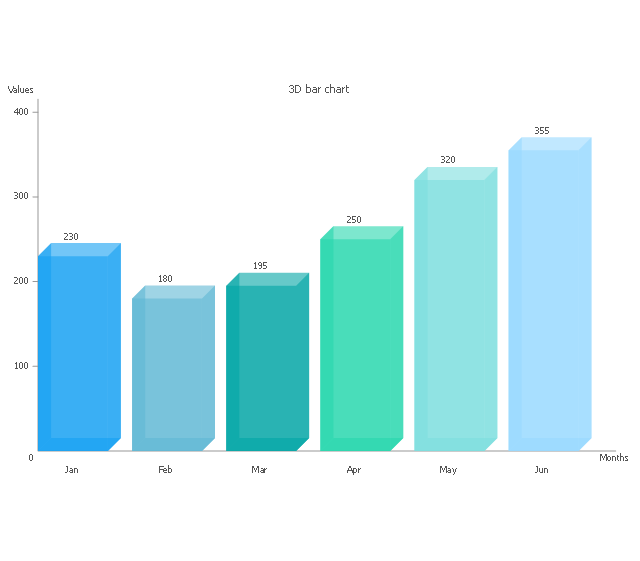
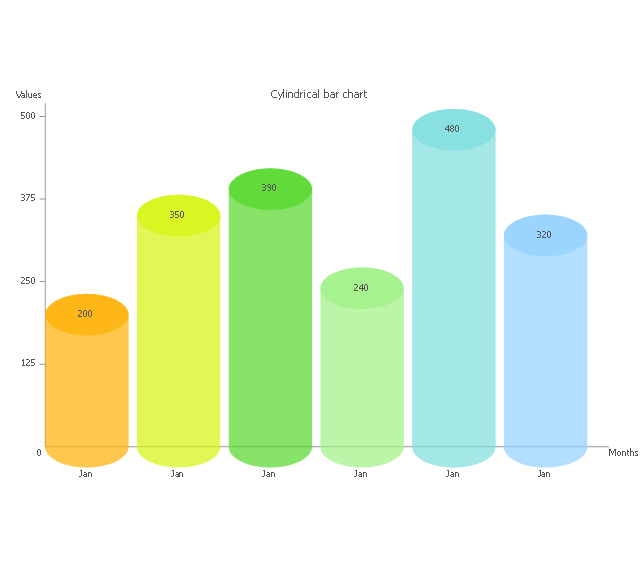
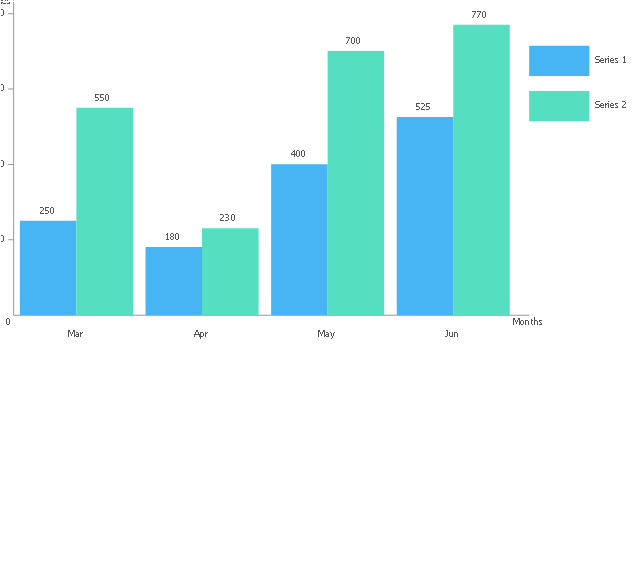
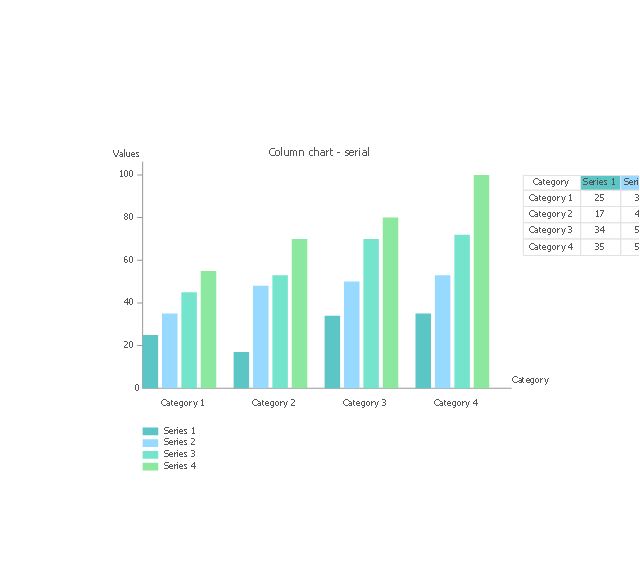
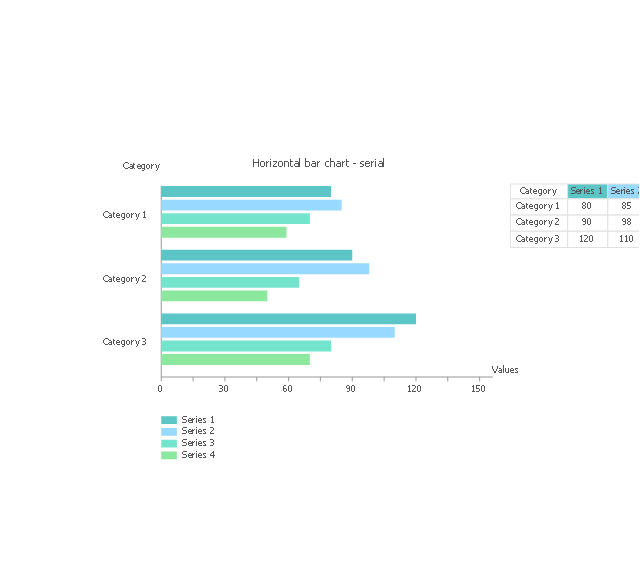
The vector stencils library "Bar charts" contains 7 templates of bar and column charts for visualizing quantitative and statistical data comparison and changes in time series. Drag template from library to your document and enter your data.
Use these shapes to draw your bar graphs in the ConceptDraw PRO diagramming and vector drawing software.
The vector stencils library "Bar charts" is included in the Bar Graphs solution from the Graphs and Charts area of ConceptDraw Solution Park.
Use these shapes to draw your bar graphs in the ConceptDraw PRO diagramming and vector drawing software.
The vector stencils library "Bar charts" is included in the Bar Graphs solution from the Graphs and Charts area of ConceptDraw Solution Park.
The vector stencils library "Trigonometric functions" contains 8 shapes of trigonometrical and inverse trigonometrical functions graphs: sine, cosine, tangent, arcsine, arccosine, arctangent, system axes.
Use these shapes to draw your geometrical diagrams and illustrations in the ConceptDraw PRO diagramming and vector drawing software extended with the Mathematics solution from the Science and Education area of ConceptDraw Solution Park.
Use these shapes to draw your geometrical diagrams and illustrations in the ConceptDraw PRO diagramming and vector drawing software extended with the Mathematics solution from the Science and Education area of ConceptDraw Solution Park.
Polar Graph
This sample shows the Polar Graph. The Polar Graph is a graph in the polar coordinate system in which the each point on the plane is defined by two values - the polar angle and the polar radius. The certain equations have very complex graphs in the Cartesian coordinates, but the application of the polar coordinate system allows usually produce the simple Polar Graphs for these equations.The vector stencils library "Bar charts" contains 7 templates of bar and column charts for visualizing quantitative and statistical data comparison and changes in time series. Drag template from library to your document and enter your data.
Use these shapes to draw your bar graphs in the ConceptDraw PRO diagramming and vector drawing software.
The vector stencils library "Bar charts" is included in the Bar Graphs solution from the Graphs and Charts area of ConceptDraw Solution Park.
Use these shapes to draw your bar graphs in the ConceptDraw PRO diagramming and vector drawing software.
The vector stencils library "Bar charts" is included in the Bar Graphs solution from the Graphs and Charts area of ConceptDraw Solution Park.
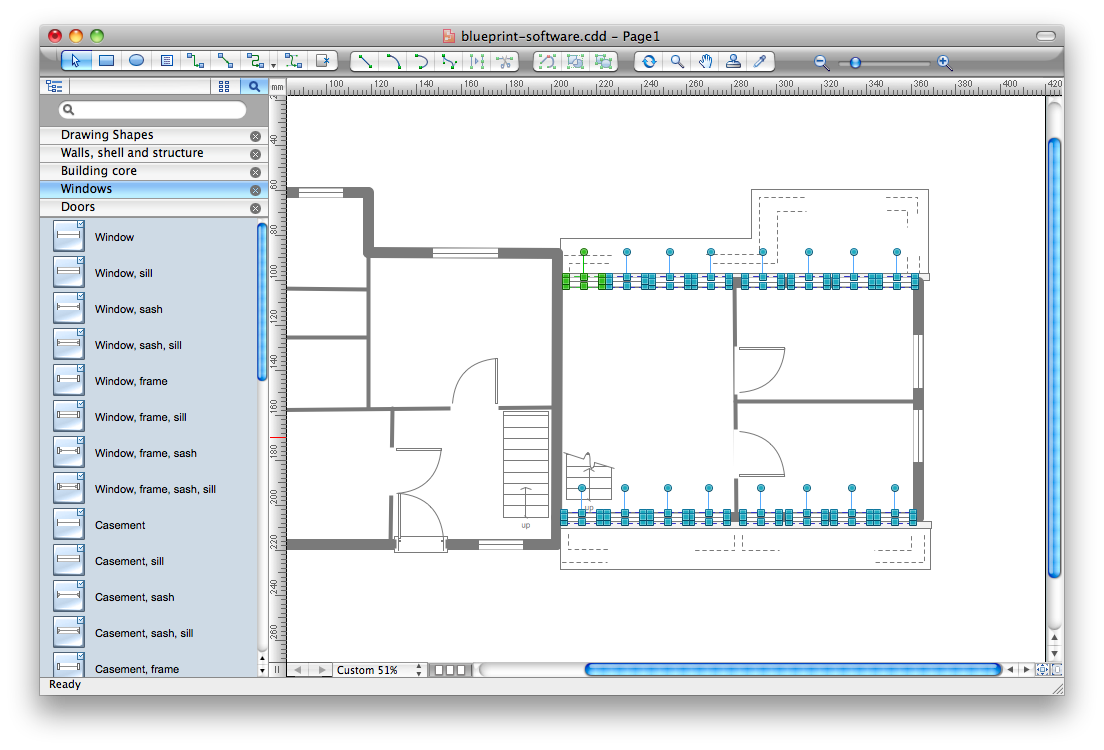
Blueprint Software
The blueprints are the set of drawings used by architects and builders in the process of construction of the buildings. The blueprints represent the top views on the buildings (homes, offices, etc.). They are drawn in the scale and use the special blueprint symbols and blueprints codes. Earlier the blueprints wer printed on the special paper and was blue. It's very easy, quick and convenient to draw the professional looking blueprints in ConceptDraw PRO diagramming and vector drawing software.HelpDesk
How to Draw a Scatter Diagram Using ConceptDraw PRO
Scatter Diagrams are used to visualize how a change in one variable affects another. A Scatter Diagram displays the data as a set of points in a coordinate system. It combines these values into single data points and displays them in uneven intervals. A Scatter Diagram can be very useful to for identifying relationships between variables, for example the relationship of price and quality rating. Making a Scatter Diagram involves many different elements that can be managed using ConceptDraw Scatter Diagram solution.Line Chart Template for Word
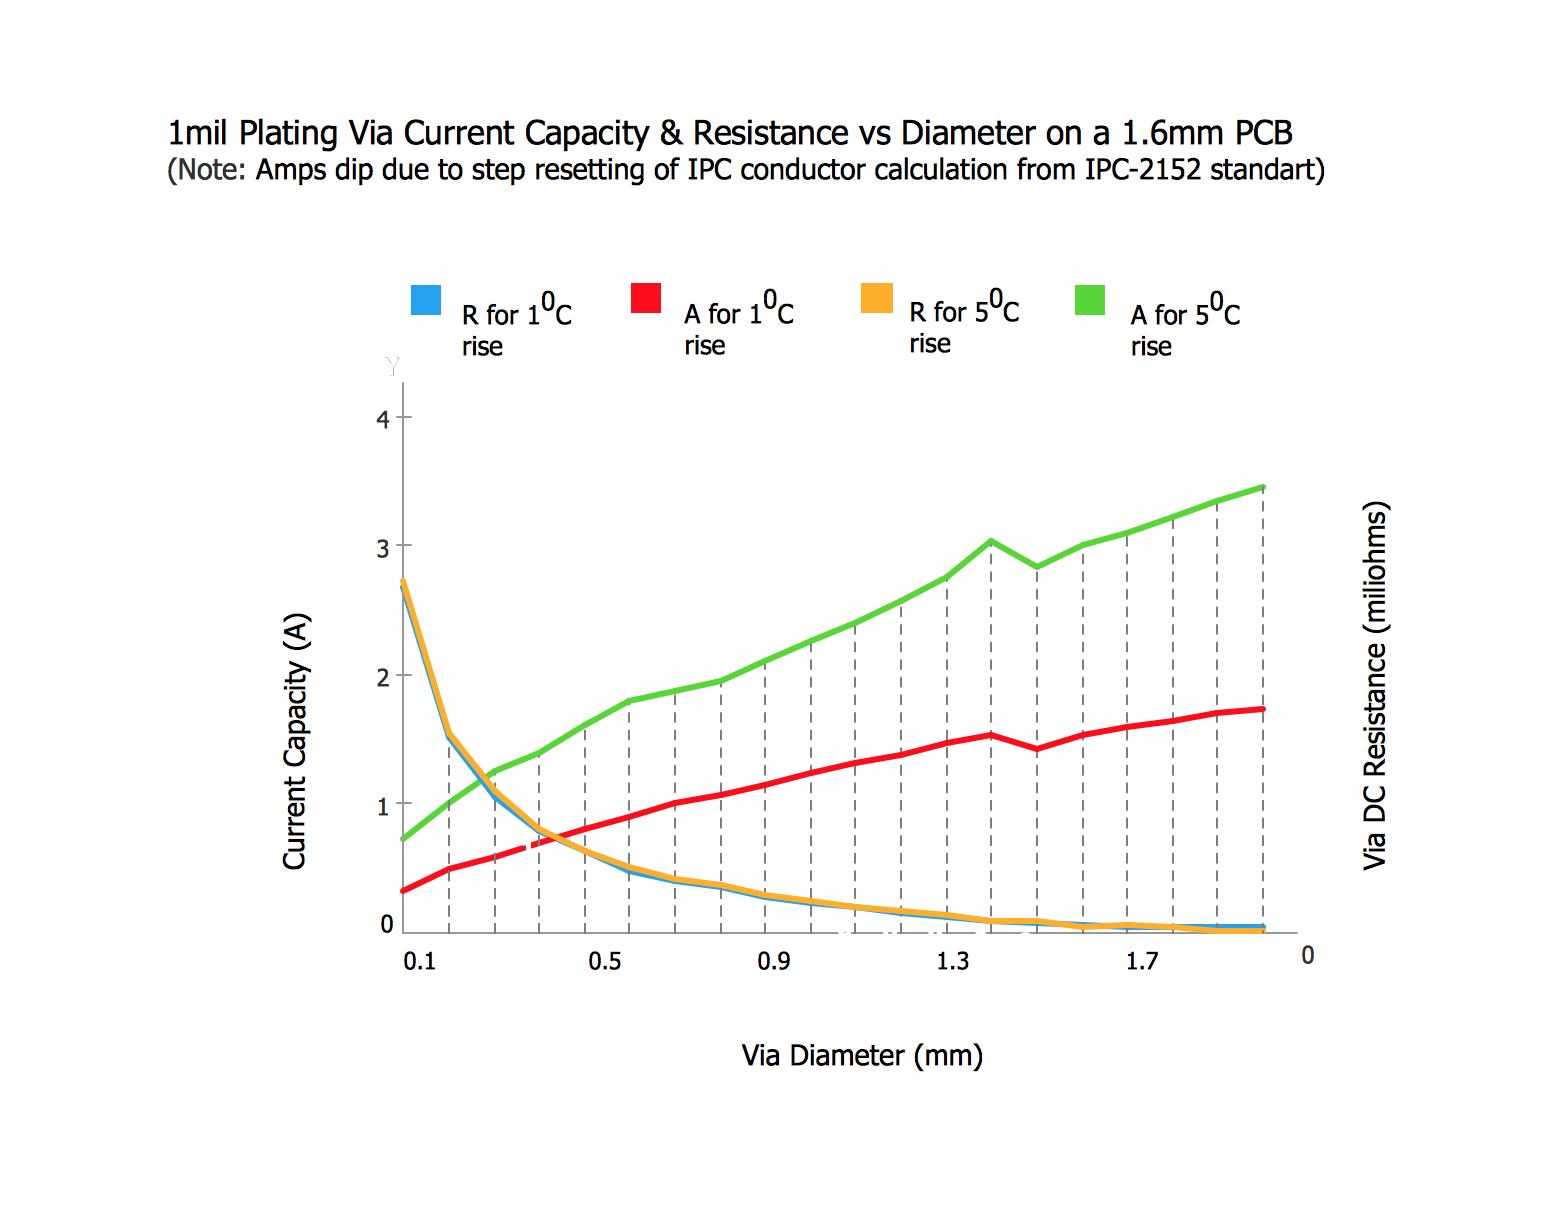
This sample was created in ConceptDraw PRO diagramming and vector drawing software using the Line Graphs Solution from Graphs and Charts area of ConceptDraw Solution Park. This sample shows the Line Chart of annual percentage change. The Line Chart allows you to clearly see the changes of data over the time.Step Area Graph
This sample shows the Step Area Graph of the PCB (Printed circuit board) Via current capacity and can be useful in electronics. It is displayed 1 mil plating Via current capacity and the resistance vs diameter on a 1.6 mm PCB. A via is an electrical connection between the layers in the electronical circuit that in PCB consists of two pads on the different electrically connected layers of the board.Pie Chart Software
A pie chart is a circular diagram showing a set of data divided into proportional slices. There are several variations of this chart such as donut chart, exploded pie chart, multi-level pie charts. Although it is not very informative when a ring chart or circle chart has many sections, so choosing a low number of data points is quite important for a useful pie chart. ConceptDraw PRO software with Pie Charts solution helps to create pie and donut charts for effective displaying proportions in statistics, business and mass media for composition comparison, i.e. for visualization of part percentage inside one total.Process Flowchart
The main reason of using Process Flowchart or PFD is to show relations between major parts of the system. Process Flowcharts are used in process engineering and chemical industry where there is a requirement of depicting relationships between major components only and not include minor parts. Process Flowcharts for single unit or multiple units differ in their structure and implementation. ConceptDraw PRO is Professional business process mapping software for making Process flowcharts, Process flow diagram, Workflow diagram, flowcharts and technical illustrations for business documents and also comprehensive visio for mac application. Easier define and document basic work and data flows, financial, production and quality management processes to increase efficiency of your business with ConcepDraw PRO. Business process mapping software with Flowchart Maker ConceptDraw PRO includes extensive drawing tools, rich examples and templates, process flowchart symbols and shape libraries, smart connectors that allow you create the flowcharts of complex processes, process flow diagrams, procedures and information exchange. Process Flowchart Solution is project management workflow tools which is part ConceptDraw Project marketing project management software. Drawing charts, diagrams, and network layouts has long been the monopoly of Microsoft Visio, making Mac users to struggle when needing such visio alternative like visio for mac, it requires only to view features, make a minor edit to, or print a diagram or chart. Thankfully to MS Visio alternative like ConceptDraw PRO software, this is cross-platform charting and business process management tool, now visio alternative for making sort of visio diagram is not a problem anymore however many people still name it business process visio tools.
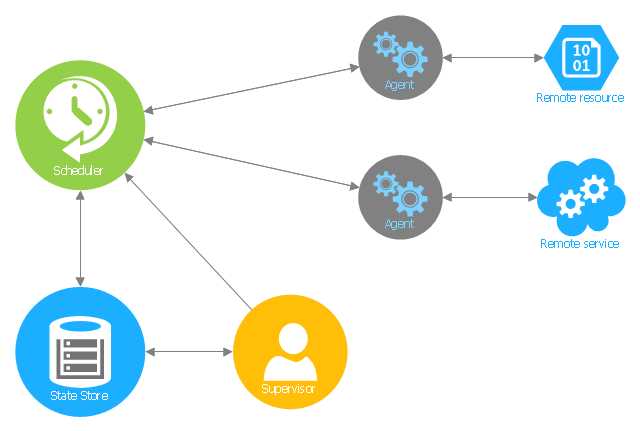
This Azure cloud architecture pattern diagram template was created on the base of figure in the article "Scheduler Agent Supervisor Pattern" from the Microsoft Developer Network (MSDN) website.
"Scheduler Agent Supervisor Pattern.
Coordinate a set of actions across a distributed set of services and other remote resources, attempt to transparently handle faults if any of these actions fail, or undo the effects of the work performed if the system cannot recover from a fault. This pattern can add resiliency to a distributed system by enabling it to recover and retry actions that fail due to transient exceptions, long-lasting faults, and process failures. ...
An application performs tasks that comprise a number of steps, some of which may invoke remote services or access remote resources. The individual steps may be independent of each other, but they are orchestrated by the application logic that implements the task.
Whenever possible, the application should ensure that the task runs to completion and resolve any failures that might occur when accessing remote services or resources. ...
If the application detects a more permanent fault from which it cannot easily recover, it must be able to restore the system to a consistent state and ensure integrity of the entire end-to-end operation. ...
The Scheduler Agent Supervisor pattern defines the following actors. These actors orchestrate the steps (individual items of work) to be performed as part of the task (the overall process):
- The Scheduler arranges for the individual steps that comprise the overall task to be executed and orchestrates their operation. ...
- The Agent contains logic that encapsulates a call to a remote service, or access to a remote resource referenced by a step in a task. ...
- The Supervisor monitors the status of the steps in the task being performed by the Scheduler. ...
The Scheduler, Agent, and Supervisor are logical components and their physical implementation depends on the technology being used." [msdn.microsoft.com/ ru-RU/ library/ dn589780.aspx]
The Azure cloud system architecture diagram template "Scheduler agent supervisor pattern" for the ConceptDraw PRO diagramming and vector drawing software is included in the Azure Architecture solutin from the Computer and Networks area of ConceptDraw Solution Park.
Accounting Flowchart Purchasing Receiving Payable and Payment
Accounting flowchart is a pictorial way to represent the flow of data in an organization and the flow of transactions process in a specific area of its accounting or financial department. Accounting Flowcharts solution contains the full set of standardized accounting flowchart symbols which will help you design in minutes various types of Accounting Flowcharts including such popular diagrams which represent the whole accounting process: Purchasing Flowchart, Receiving Flowchart, Voucher Payable Flowchart, Treasurer Flowchart, Payment Flowchart.GUI Prototyping with ConceptDraw PRO
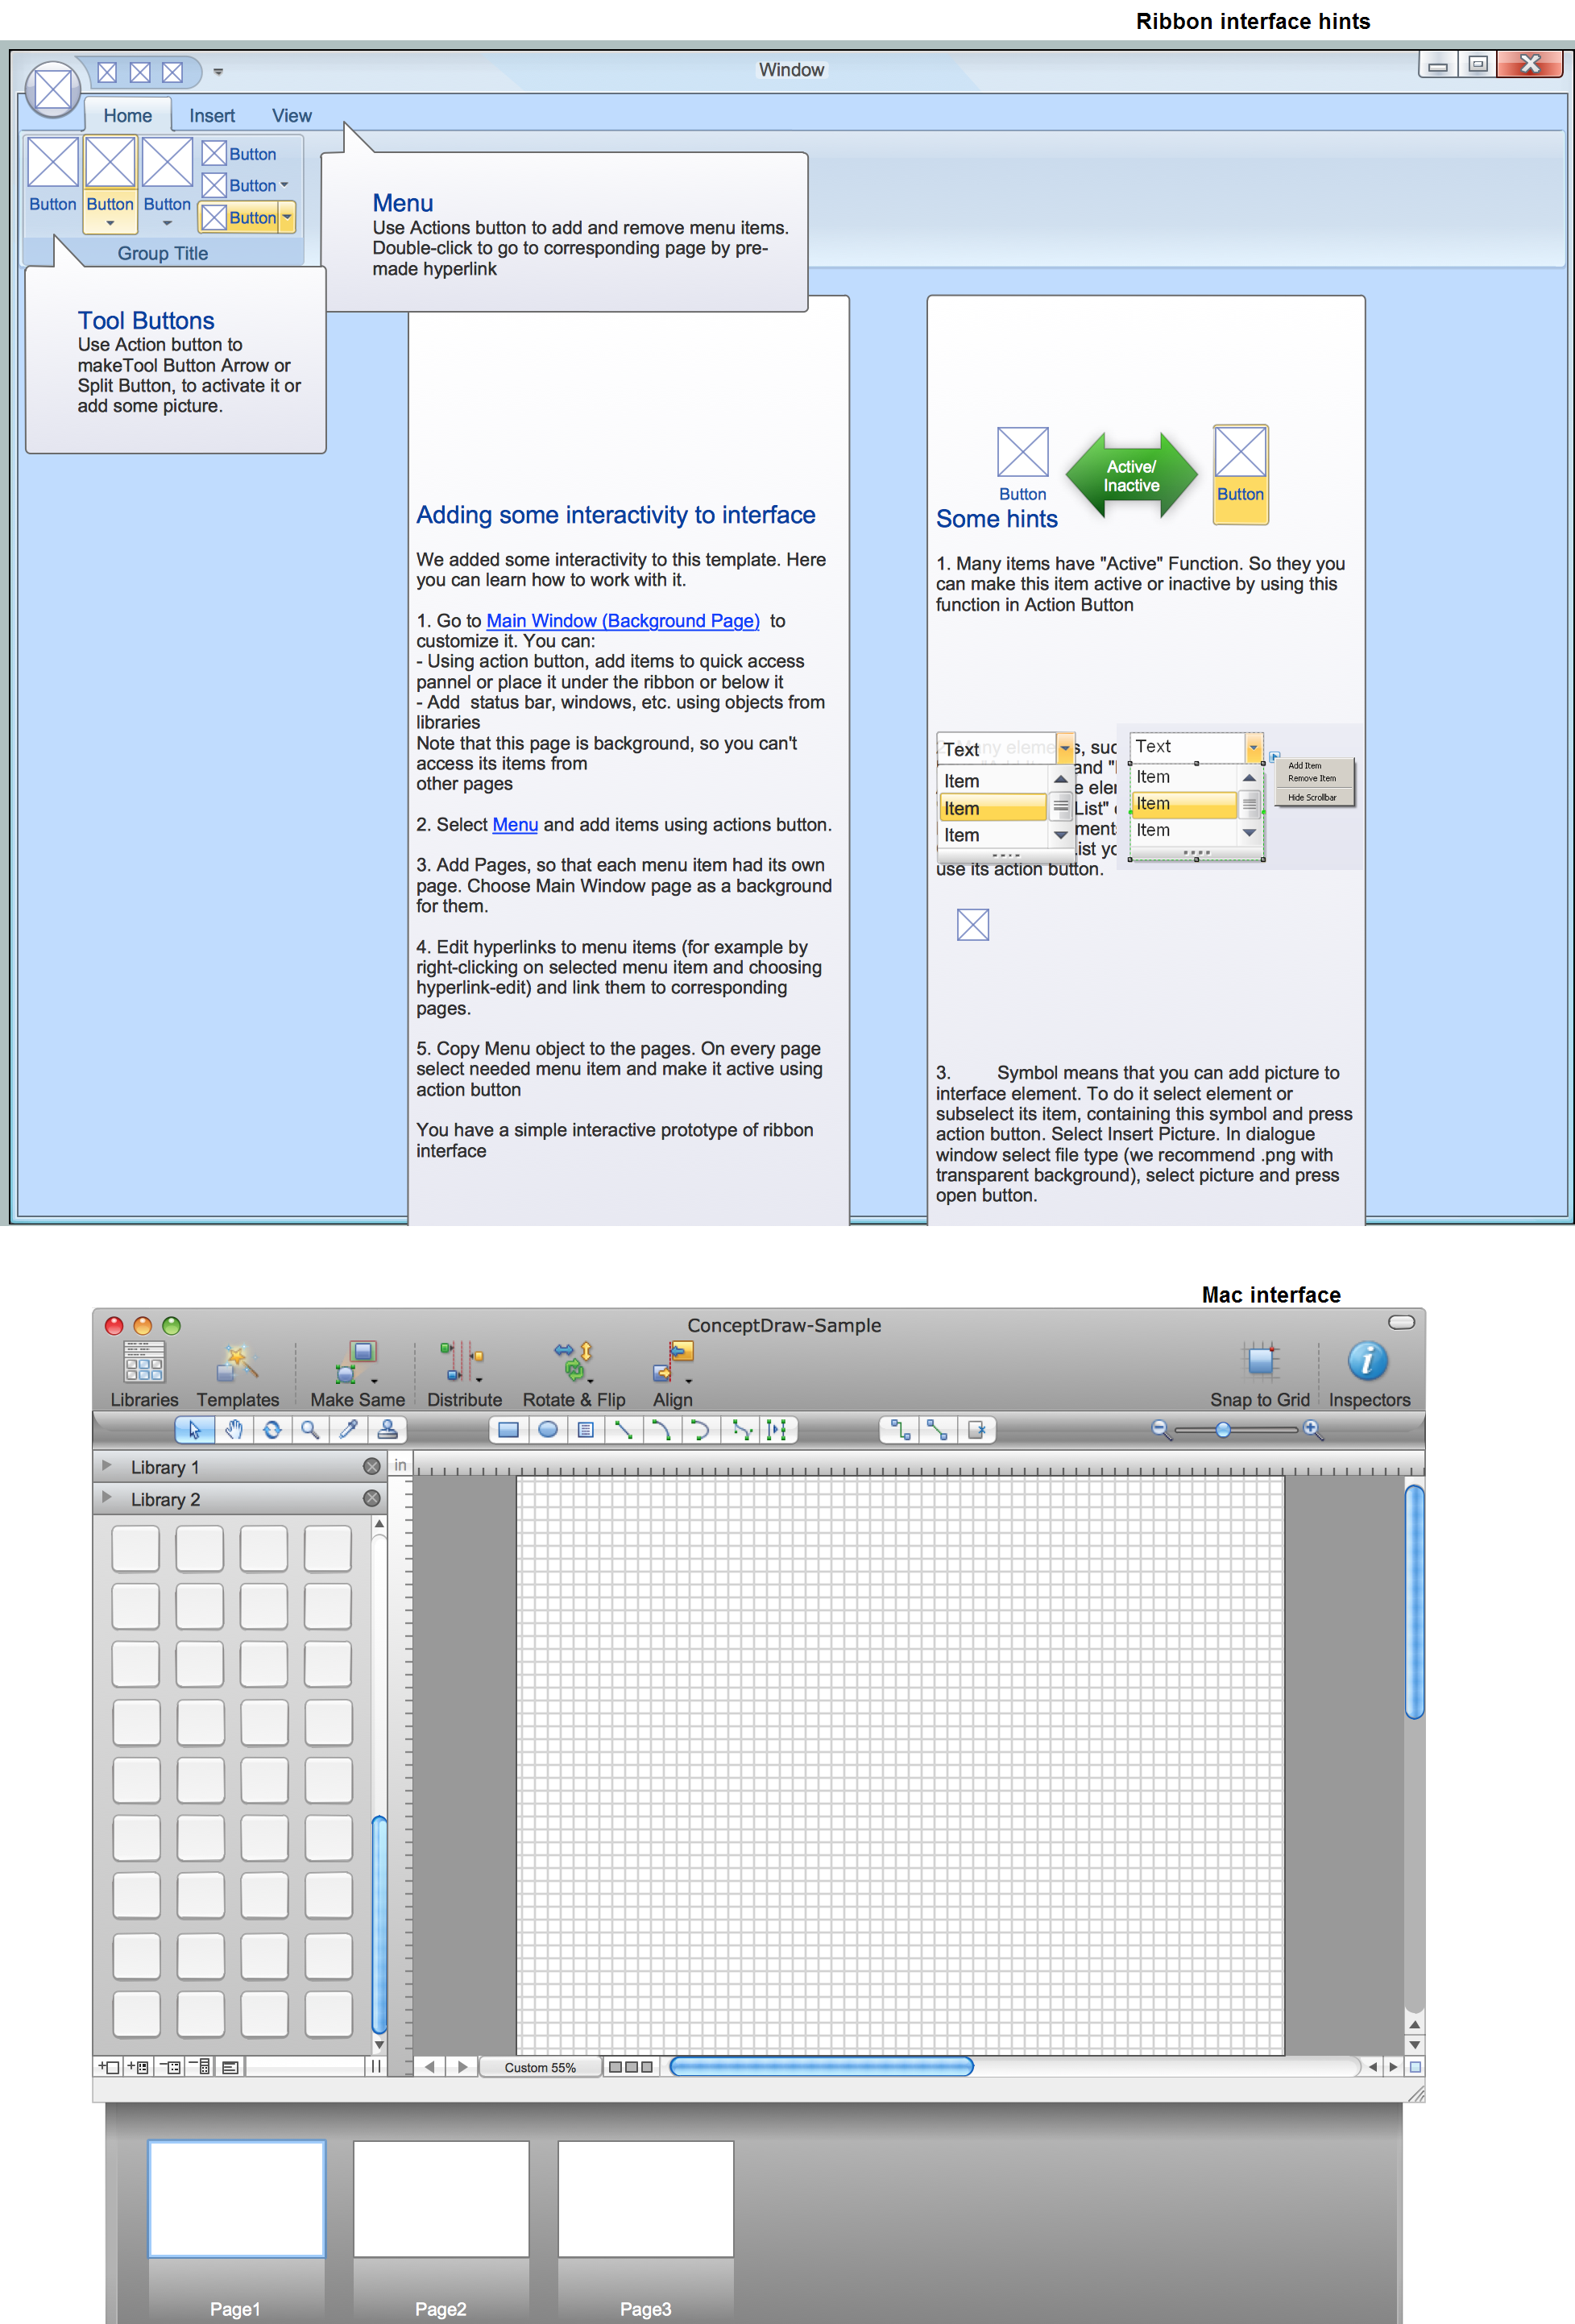
All about prototyping. GUI Prototyping with ConceptDraw. Download prototyping software.- Cartesian coordinate system
- Trigonometric functions - Vector stencils library
- Bar charts - Vector stencils library
- Polar Graph | Sample Pictures Of Polar Coordinate
- Graph Of Communication System Of The World
- Sales Growth. Bar Graphs Example | What Is a Picture Graph ...
- Trigonometric functions - Vector stencils library | Design elements ...
- Process Flow Diagram | How to Design a Fast-Food Restaurant ...
- Ice Hockey Rink Dimensions | Trigonometric functions - Vector ...
- Design elements - Trigonometric functions | Trigonometric functions ...
- How To use House Electrical Plan Software | ConceptDraw Solution ...
- Sales Growth. Bar Graphs Example | Bar Chart Examples | Business ...
- Polar Graph | Polar Area Chart
- Polar Graph | Sample Drawing Plane Of Home
- Bar Chart Software | Bar charts - Vector stencils library | Column ...
- Simple Diagramming | Network diagrams with ConceptDraw PRO ...
- Online Collaboration via Skype | HVAC Business Plan | Sales ...
- Data Flow Diagram For Event Management System
- Sales Growth. Bar Graphs Example | Bar Diagrams for Problem ...
