 Scatter Diagrams
The Scatter Diagrams solution extends ConceptDraw PRO v10 functionality with templates, samples, and a library of vector stencils that make construction of a Scatter Plot easy. The Scatter Chart Solution makes it easy to design attractive Scatter Diagrams used in various fields of science, work, and life activities. ConceptDraw PRO lets you enter the data to the table and construct the Scatter Plot Graph automatically according to these data.
 Correlation Dashboard
Correlation dashboard solution extends ConceptDraw PRO software with samples, templates and vector stencils library with Scatter Plot Charts for drawing the visual dashboard visualizing data correlation.
 Circle-Spoke Diagrams
Examples of subject areas that are well suited to this approach are marketing, business, products promotion, process modeling, market, resource, time, and cost analysis. Circle-Spoke Diagrams are successfully used in presentations, conferences, management documents, magazines, reportages, reviews, reports, TV, and social media.
Network Diagram Software
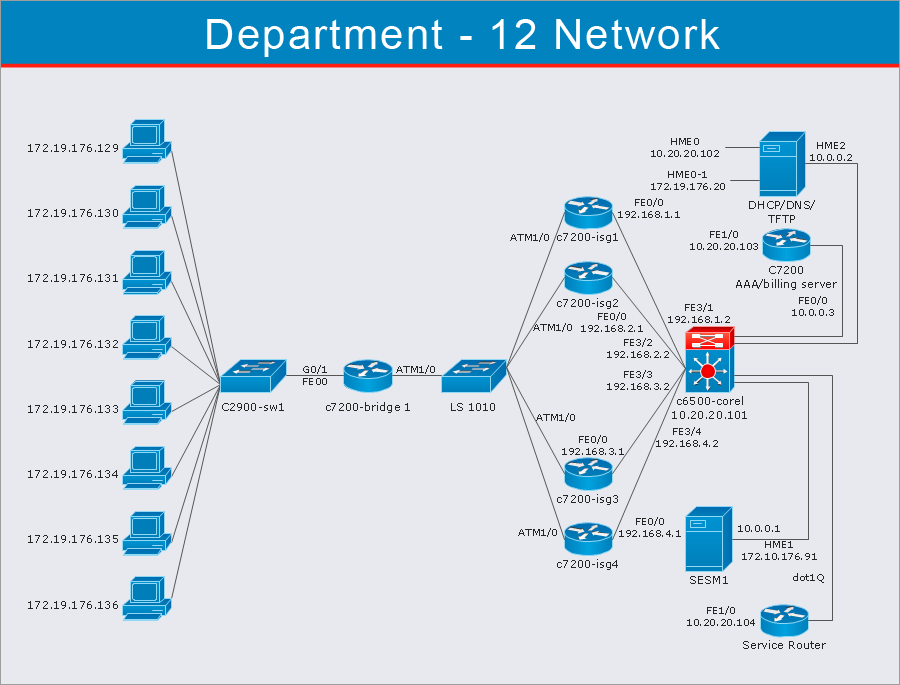
ConceptDraw Network Diagram Software - Network design software for network drawings with abundant examples and templates. Create computer network designs, diagrams and schematics using ConceptDraw.
 Total Quality Management TQM Diagrams
Total Quality Management Diagrams solution extends ConceptDraw PRO software with samples, templates and vector stencils library for drawing the TQM flowcharts.
 Fishbone Diagram
Fishbone Diagrams solution extends ConceptDraw PRO software with templates, samples and library of vector stencils for drawing the Ishikawa diagrams for cause and effect analysis.
- How To Draw Correlation Diagram Video Download
- Fishbone Diagram | HVAC Plans | Correlation Dashboard | Class ...
- Network diagrams with ConceptDraw PRO | Business Diagram ...
- Data Flow Diagrams (DFD) | Entity-Relationship Diagram (ERD ...
- Sales Flowcharts | Correlation Dashboard | Business Process ...
- Scatter Diagrams | Scatter Graph | Scatter Graph Charting Software ...
- KPIs and Metrics | Business Intelligence Dashboard | Competitor ...
- Design elements - Scatter graphs | Scatter graphs - Vector stencils ...
- Kpi Correlation Template
- Example of DFD for Online Store (Data Flow Diagram ) DFD ...
- Design elements - Correlation charts | Correlation Dashboard | What ...
- Correlation Dashboard | Process Flow Chart | How to Draw a Line ...
- Scatter Diagrams | ConceptDraw Solution Park | Value Stream ...
- Scatter Diagrams | Blank Scatter Plot | How to Draw a Scatter ...
- Easy Flowchart Of Correlation
- Cafe and Restaurant Floor Plans | Organizational Charts ...
- Correlation Dashboard | Correlation dashboard - Template | Design ...
- How To Create a MS Visio Business Process Diagram Using ...
- Scatter Diagrams | Scatter Chart Examples | Scatter Graph Charting ...
