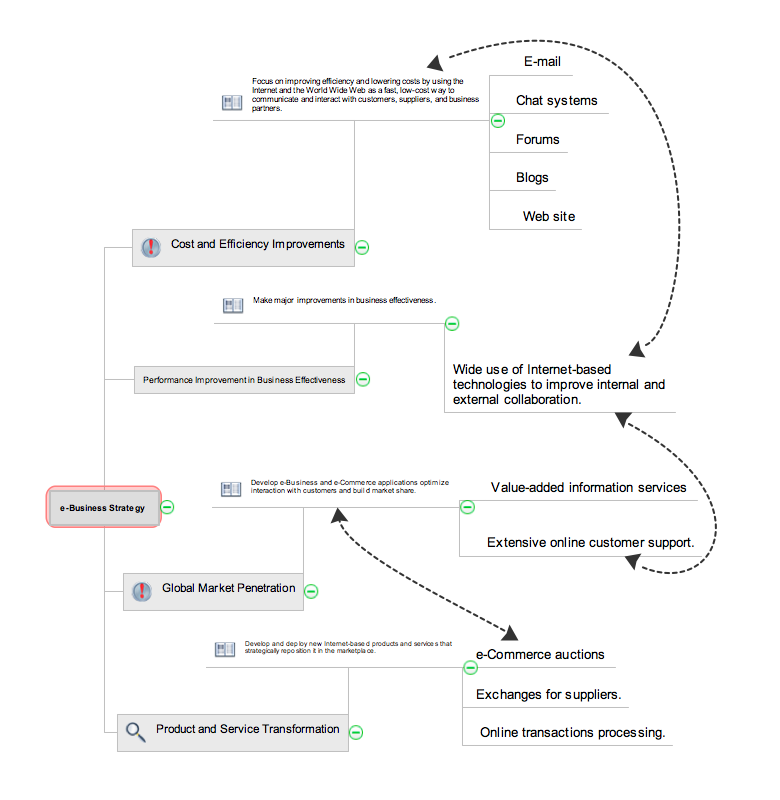
 Seven Management and Planning Tools
Seven Management and Planning Tools solution extends ConceptDraw PRO and ConceptDraw MINDMAP with features, templates, samples and libraries of vector stencils for drawing management mind maps and diagrams.
Flow chart Example. Warehouse Flowchart
Warehouse Flowcharts are various diagrams that describe the warehousing and inventory management processes on the warehouses. Typical purposes of Warehouse Flowcharts are evaluating warehouse performance, measuring efficiency of customer service and organizational performance. This type of Workflow diagrams can be used for identifying any disconnection between business activities and business objectives. They are effectively used by warehouse-related people and organizations, manufacturers, wholesalers, exporters, importers, transporters, and others. Standard Warehousing process flow diagram and standard Workflow diagram are used for process identification for further evaluating effectiveness and profitability of overall business process. Use the ConceptDraw PRO vector graphic software extended with Flowcharts solution to design your own professional-looking Workflow diagrams and Flowcharts of any types, including the Warehouse flowchart, Process flow diagrams which depict in details all steps of Warehouse packages flow. Microsoft Visio, designed for Windows users, can’t be opened directly on Mac. But fortunately, there are several Visio alternatives for Mac which will help Mac users to work Visio files. With ConceptDraw PRO, you may open, edit and save files in Visio format.
Software Work Flow Process in Project Management with Diagram
This sample was created in ConceptDraw PRO diagramming and vector drawing software using the Workflow Diagrams Solution from the Software Development area of ConceptDraw Solution Park.This sample shows the Workflow Diagram that clearly illustrates stages a BPM consists of and relations between all parts of business. The Workflow Diagrams are used to represent the transferring of data during the work process, to study and analysis the working processes, and to optimize a workflow.
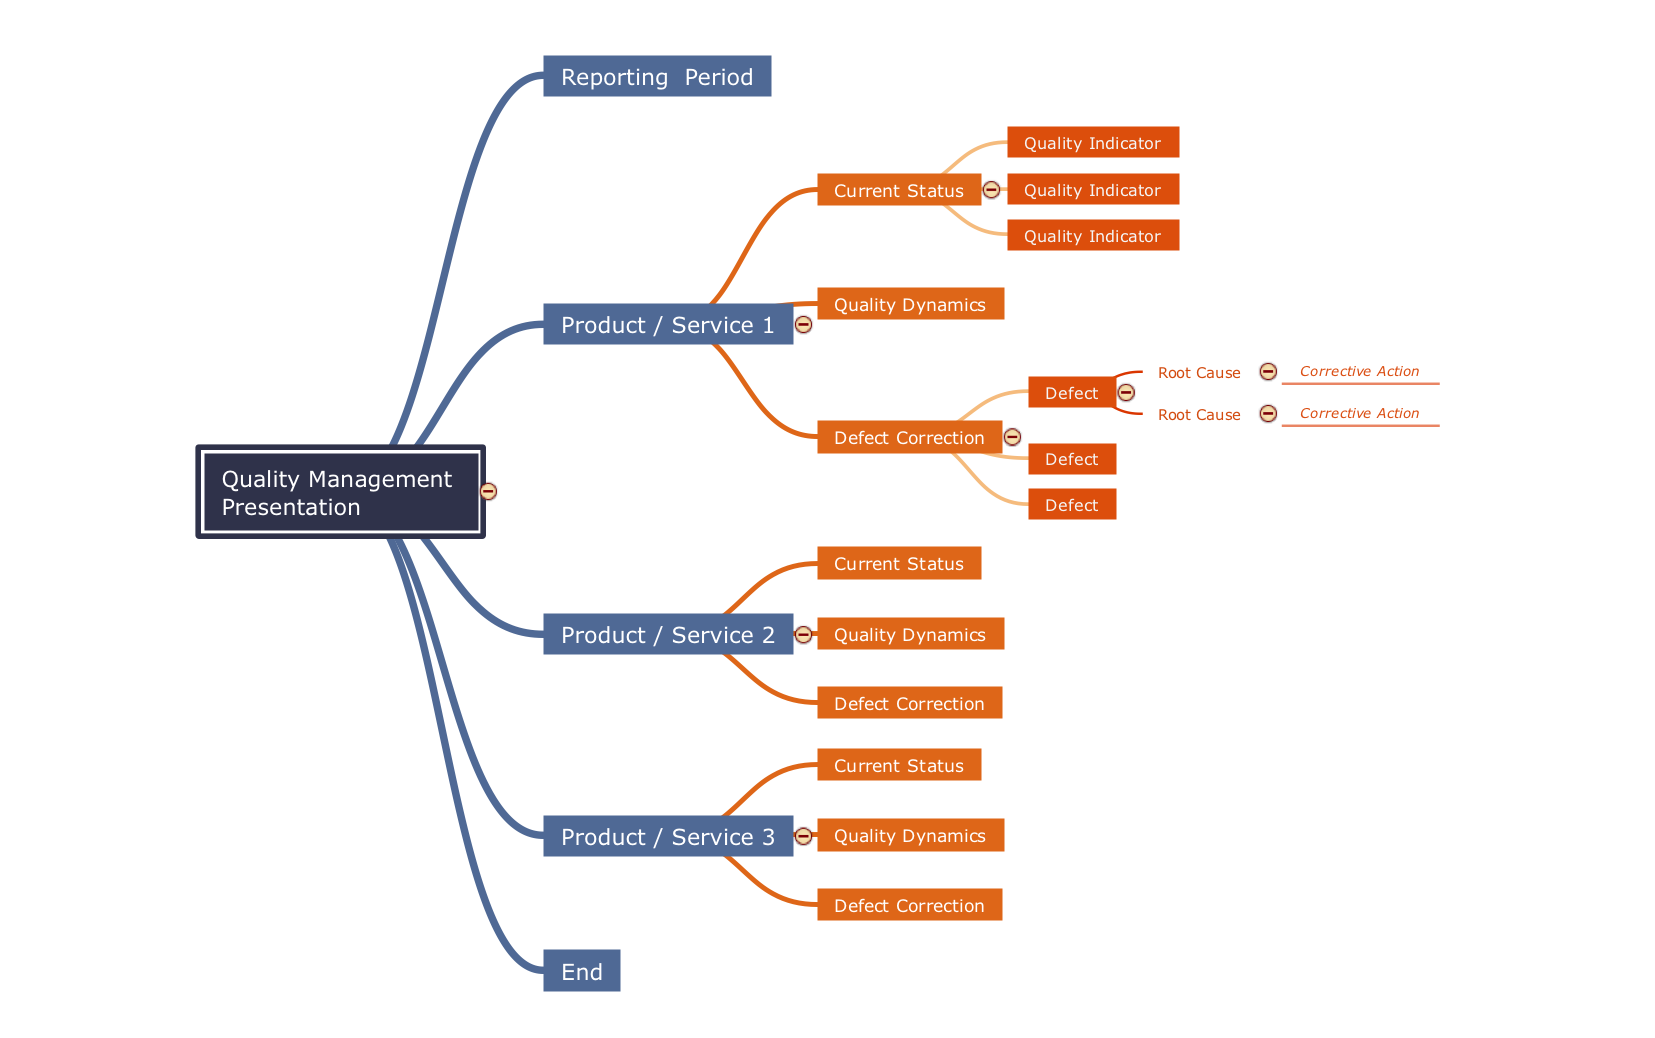
 Quality Mind Map
This solution extends ConceptDraw MINDMAP software with Quality Management Mind Maps (Presentations, Meeting Agendas, Problem to be solved).
The vector stencils library "Management pictograms" contains 72 management pictograms.
Use it to create your management infogram in the ConceptDraw PRO diagramming and vector drawing software.
The flat icons example "Management pictograms - Vector stencils library" is included in the solution "Marketing infographics" from the "Business infographics" area of ConceptDraw Solution Park.
Use it to create your management infogram in the ConceptDraw PRO diagramming and vector drawing software.
The flat icons example "Management pictograms - Vector stencils library" is included in the solution "Marketing infographics" from the "Business infographics" area of ConceptDraw Solution Park.
Mind Map - Quality Structure
ConceptDraw MINDMAP v7 is a good way to describe visual instructions on any quality process.How to show a mind map presentation via Skype
Video tutorials on ConceptDraw products. Try it today!HelpDesk
How to Create a Fishbone (Ishikawa) Diagram Quickly
A Fishbone (Ishikawa) diagram is also called cause-and-effect diagram. Fishbone diagram is often used in business to determine the cause of some problem. The diagram illustrates the main causes and sub-causes leading to an event. The main goal of the Fishbone diagram is to illustrate in a graphical way the relationship between a given outcome and all the factors that influence this outcome. The complete diagram resembles a fish skeleton as its name implies. The ability to create a Fishbone Diagram is supported by the Fishbone Diagram solution. Use ConceptDraw MINDMAP for structuring data and then ConceptDraw PRO for generating a Fishbone Diagram from mind map structure.- Management pictograms - Vector stencils library | Seven ...
- Flowchart design. Flowchart symbols, shapes, stencils and icons ...
- Risk Diagram (Process Decision Program Chart) | Process decision ...
- Risk diagram (PDPC) - Template | Context Diagram Template | Risk ...
- Diagram Pdpc
- Process Flowchart | Flowchart design. Flowchart symbols, shapes ...
- CORRECTIVE ACTIONS PLANNING. Risk Diagram (PDPC) | How ...
- Risk Diagram (Process Decision Program Chart) | Risk Diagram ...
- CORRECTIVE ACTIONS PLANNING. Risk Diagram (PDPC ...
- Influence Diagram | Root Cause Tree Diagram | Entity Relationship ...
- Org Chart Diagram | WBS Diagram | Process Flowchart | Create ...
- Basic Flowchart Symbols and Meaning | Mechanical Drawing ...
- PDPC | Risk diagram (PDPC) - Template | Process decision ...
- Customer Relationship Management | 7 Management & Planning ...
- Process decision program chart (PDPC) - Personal activity | PDPC ...
- Process decision program chart (PDPC) - Personal activity | Process ...
- Fault Tree Diagram | High level fault tree | How to Make Audio and ...
- Customer Relationship Management | 7 Management & Planning ...
- PROBLEM ANALYSIS. Prioritization Matrix | PROBLEM ANALYSIS ...
- SWOT Analysis | Network Security Diagrams | Network Security ...


