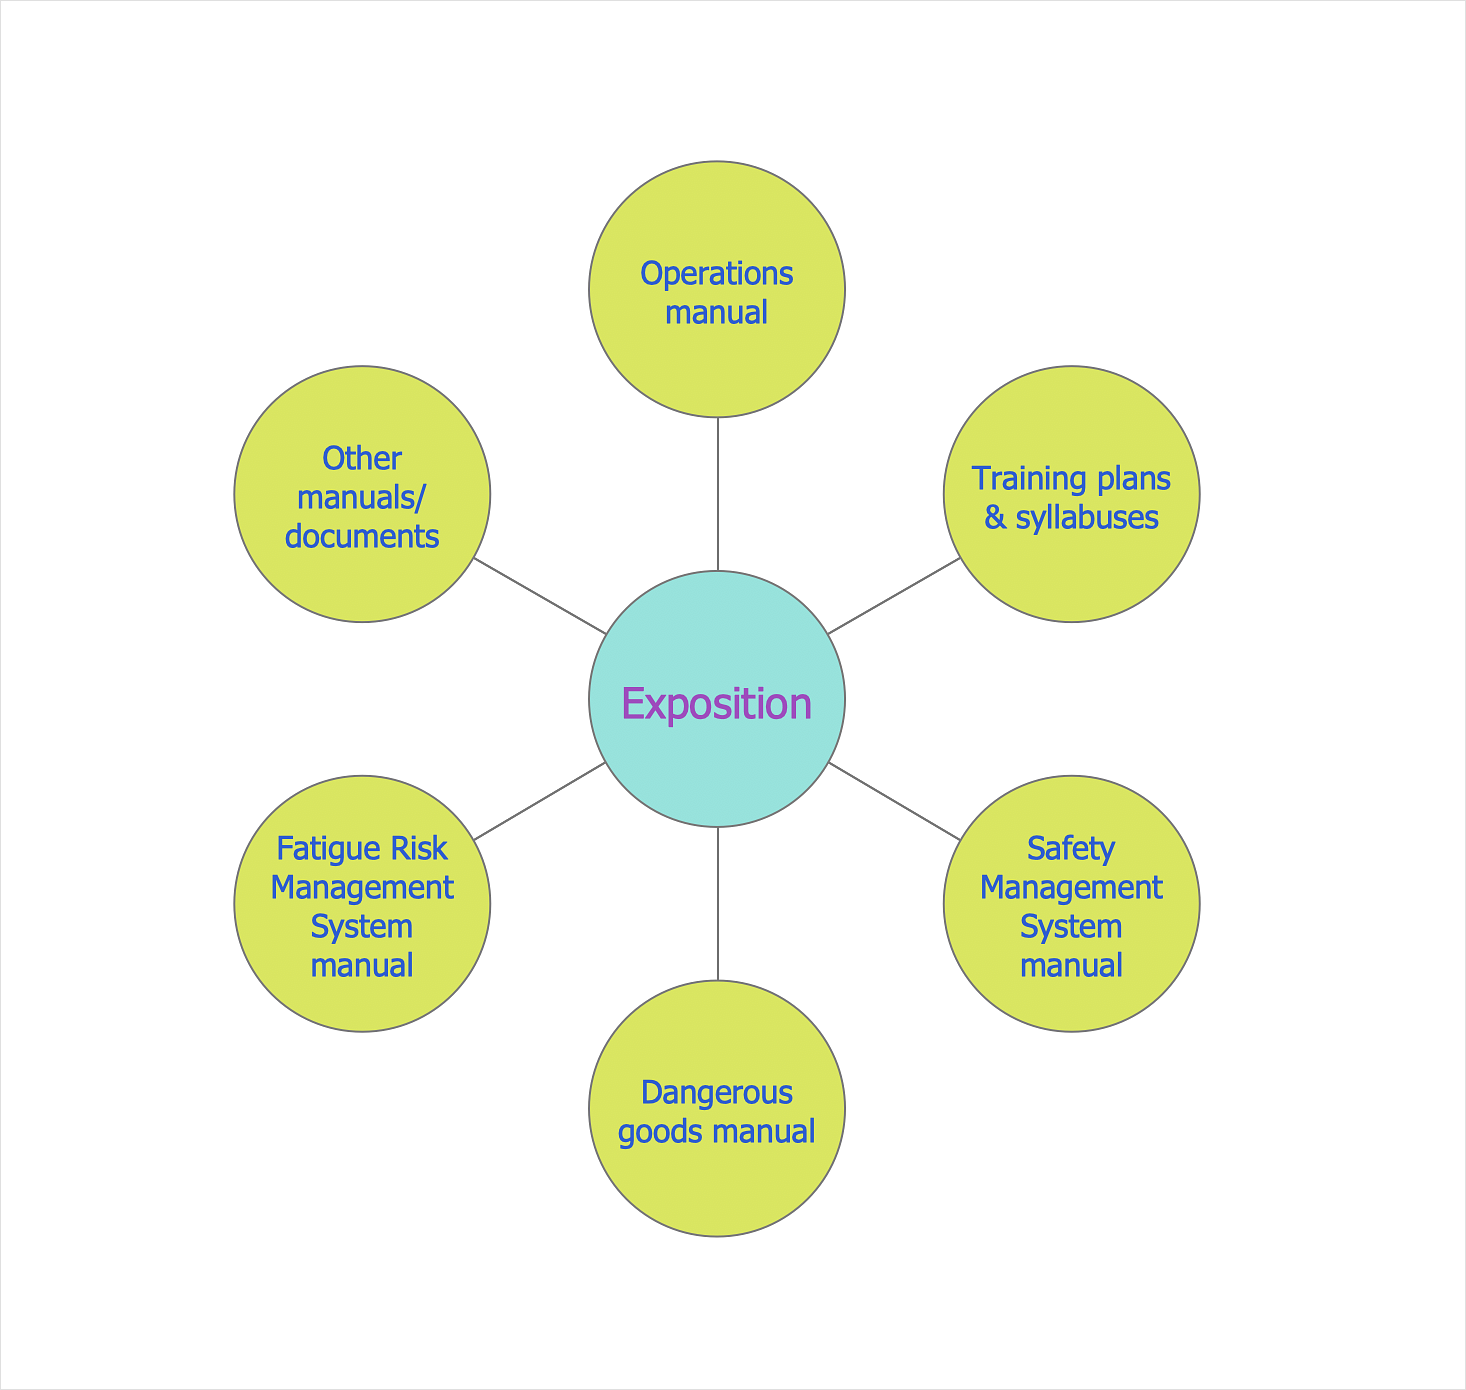
Circle Diagrams
The Circle Diagrams are the diagrams which represent the central element surrounded by other items in a circle. This type of diagram is very popular and widely used in marketing and management, for process modeling, market, resource, time and cost analysis, for visualization causes and effects. If you dream to design the Circle Diagrams quick and easy – the ConceptDraw DIAGRAM software extended with Circle-Spoke Diagrams Solution from the "Diagrams" Area is exactly what you need.HelpDesk
How to Draw a Circle-Spoke Diagram
Making circle-spoke diagram is a very useful technique if you want to explore cause and effect. A Circle-Spoke Diagram is a tool that is often used in the marketing sphere. Circle-spoke diagram consists of a central circle surrounded in a round arrangement by related sub-circles. They are used to depict the features or components of a central item in a number of areas. Circle-spoke diagram is widely used in marketing and management documents as well as presentations. A Circle-Spoke Diagram is a very useful tool if you want to perform the Cause and Effect analysis. ConceptDraw DIAGRAM delivers the ability to make circle-spoke diagrams of various styles with its Circle-Spoke Diagrams solution.Relative Circular Diagram
ConceptDraw DIAGRAM extended with Target and Circular Diagrams Solution from the Marketing Area is a convenient and useful tool for creating Relative Circular Diagrams. Target and Circular Diagrams Solution with large number of templates and samples of Circular Diagrams, and Circular Diagram library with various vector objects will help you in your diagramming process.Circular Diagram
Circular Diagram is a type of diagram widely used in marketing and economics for visualization information in a clear and visual form. ConceptDraw DIAGRAM diagramming and vector drawing software offers the useful tools of the Target and Circular Diagrams solution from the Marketing area of ConceptDraw Solution Park for effective drawing a Circular Diagram of any complexity and design.HelpDesk
How to Draw a Circular Arrows Diagram
The cyclic recurrence is a fundamental property of multiple systems. The cycle is a process which consists from elements (phases, stages, stages) following each other. Many processes in astronomy, biology, chemistry, physics, mathematics, etc. have a cycle properties. It is also widely used in information technologies and marketing analysis. Graphical representation of cyclic processes can have many forms. It can be a circle, parabola, hyperbola, ellipse and others. A Circular Arrows Diagram is used as one of the statistical charts in the business, mass media and marketing. ConceptDraw DIAGRAM provides its users tools for making easy drawing Circular Arrows Diagrams.
 Circular Arrows Diagrams
Circular Arrows Diagrams solution extends ConceptDraw DIAGRAM with extensive drawing tools, predesigned samples, Circular flow diagram template for quick start, and a library of ready circular arrow vector stencils for drawing Circular Arrow Diagrams, Segmented Cycle Diagrams, and Circular Flow Diagrams. The elements in this solution help managers, analysts, business advisers, marketing experts, scientists, lecturers, and other knowledge workers in their daily work.
Circle Spoke Diagram Template
ConceptDraw DIAGRAM diagramming and vector drawing software offers the Circle Spoke Diagram Template included in the Circle-Spoke Diagrams Solution from the "Diagrams" Area. Use of ready template is the easiest way of drawing professional looking Circle-Spoke Diagrams.
 Target and Circular Diagrams
This solution extends ConceptDraw DIAGRAM software with samples, templates and library of design elements for drawing the Target and Circular Diagrams.
What Is a Circle Spoke Diagram
What Is a Circle Spoke Diagram? It is a diagram which have a central item surrounded by other items in a circle. The Circle Spoke Diagrams are often used to show the features or components of the central item in marketing and management documents and presentations. ConceptDraw DIAGRAM extended with Circle-Spoke Diagrams Solution from the "Diagrams" Area is the best software for creating Circle-Spoke Diagrams.Circles Venn Diagram
This example shows the 4 Circle Venn Diagram. The Venn Diagram visualizes all possible logical relations between several sets. The sets are represented as circles on the Venn Diagram. On this example you can see the intersections of 4 sets. Venn Diagrams are widely used in mathematics, logic, statistics, marketing, sociology, etc.- Circle Diagrams | Circular Diagram | Best Diagramming | Circle ...
- How To Create a Visio Circle -Spoke Diagram Using ConceptDraw ...
- How To Create a Visio Circle -Spoke Diagram Using ConceptDraw ...
- Create Circular Diagram
- Circular Flow Diagram Template | Basic Flowchart Symbols and ...
- Target and Circular Diagrams | Circular Flowchart Visio
- How to Create a Pie Chart | Circular arrows diagrams - Vector ...
- Make A Circle Diagram
- Stakeholder Onion Diagrams | How To Create Onion Diagram | How ...
- How to Draw a Circular Arrows Diagram Using ConceptDraw PRO ...


