This site uses cookies. By continuing to browse the ConceptDraw site you are agreeing to our Use of Site Cookies.

decision maker, analytic hierarchy process (ahp), t chart, decision matrix, decision tree analysis Decision Making

decision maker, analytic hierarchy process (ahp), t chart, decision matrix, decision tree analysis
The Decision Making solution offers the set of professionally developed examples, powerful drawing tools and a wide range of libraries with specific ready-made vector decision icons, decision pictograms, decision flowchart elements, decision tree icons, decision signs arrows, and callouts, allowing the decision maker (even without drawing and design skills) to easily construct Decision diagrams, Business decision maps, Decision flowcharts, Decision trees, Decision matrix, T Chart, Influence diagrams, which are powerful in questions of decision making, holding decision tree analysis and Analytic Hierarchy Process (AHP), visual decomposition the decision problem into hierarchy of easily comprehensible sub-problems and solving them without any efforts.
HelpDesk

How to Draw a Decision-Making Diagram

The Decision-Making solution provides ConceptDraw DIAGRAM users with vector libraries, containing a full set of flowchart symbols. Also, it offers a number of templates and samples, making short work of creating a graphical view of decision-making processes.

Decision Tree Analysis

Decision trees are widely used in operations research. It is mostly applied in decision analysis in order to help and identify that strategy that most likely may lead to reaching a goal. It is also known as a popular tool in machine learning, thus it worth knowing about it from this article.

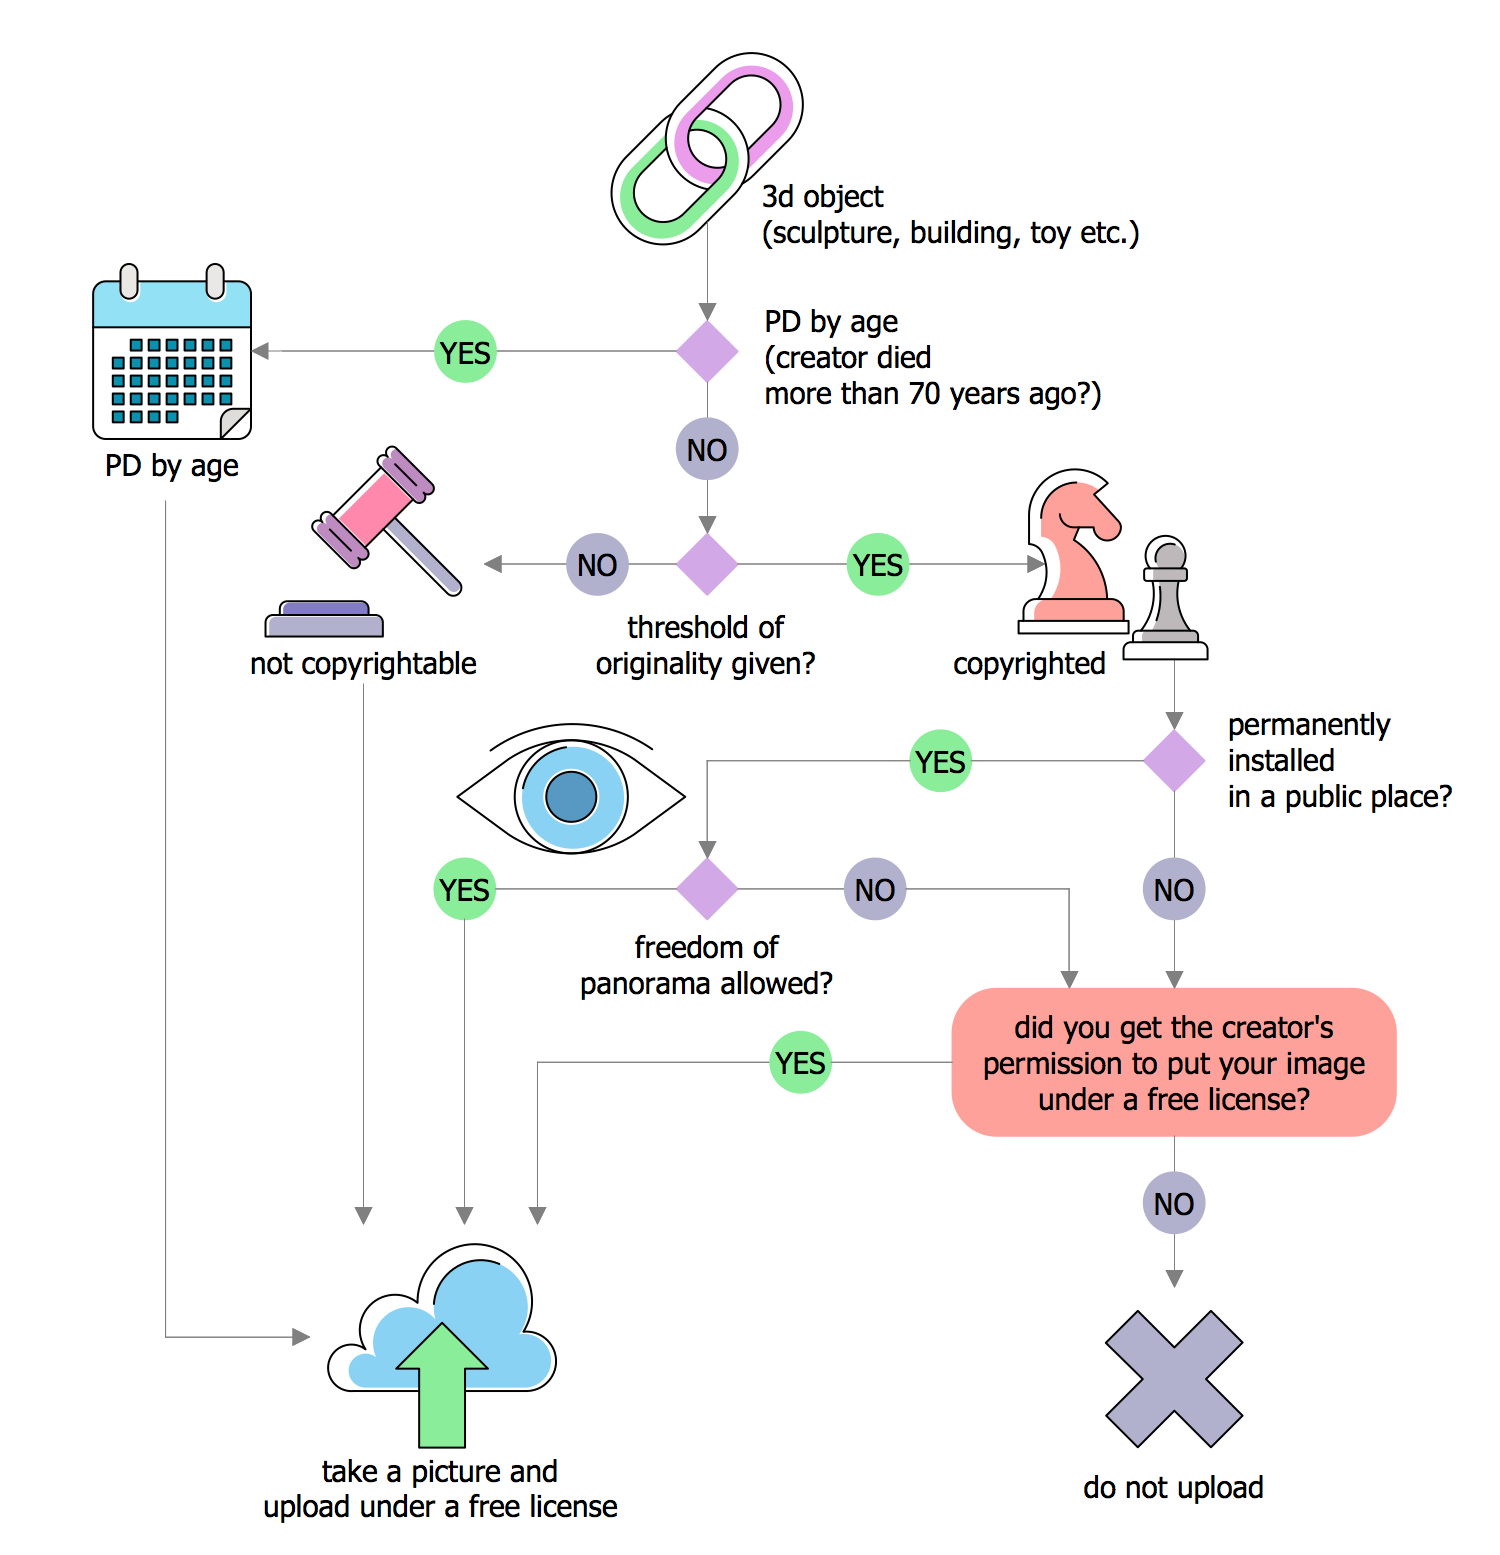
The ConceptDraw DIAGRAM diagramming and drawing software is the one that can help with creating the needed drawing, including a decision tree. Making decision tree analysis, it is always easy to make the needed matrix as there are plenty of pre-made templates to be used.

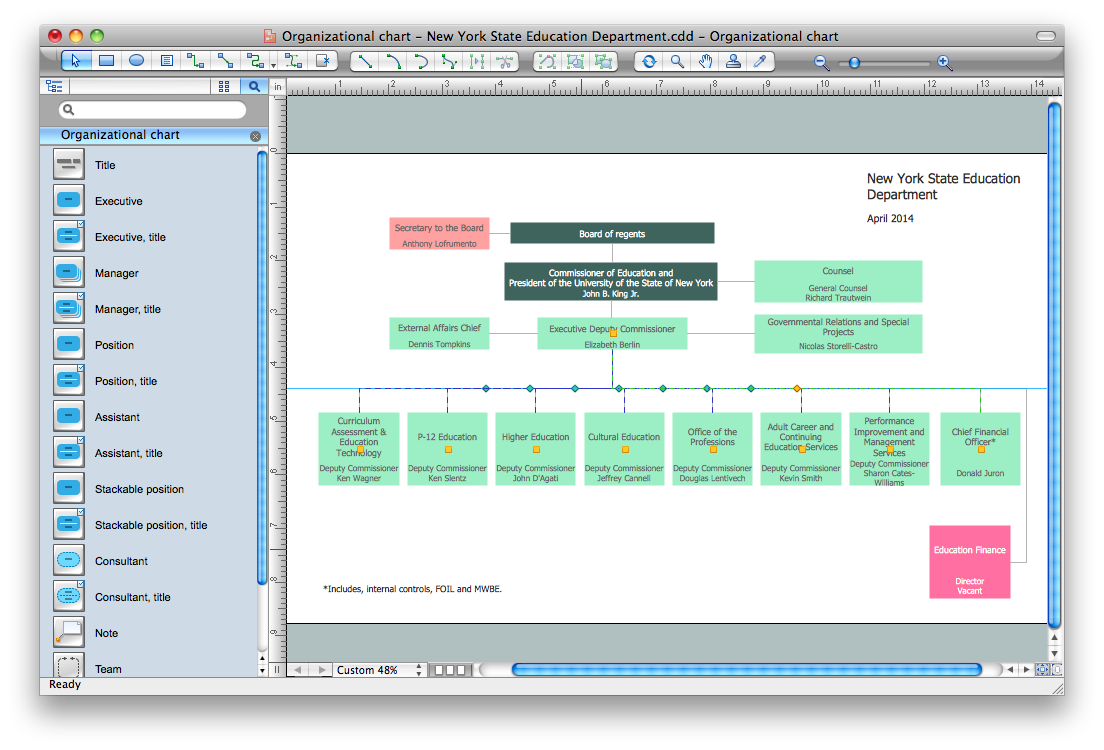
Organization Chart Software

Create Organizational Chart Software - You need create Organizational Chart? Nothing could be easier with ConceptDraw DIAGRAM diagramming and vector drawing software. ConceptDraw DIAGRAM presents the Organizational Charts Solution from the Management Area that will allow you to draw the Organization Charts of any difficulty easy and quick.
How to draw an Organizational Chart

marketing diagram, marketing chart Marketing Diagrams

marketing diagram, marketing chart
Marketing Diagrams solution extends ConceptDraw DIAGRAM diagramming software with abundance of samples, templates and vector design elements intended for easy graphical visualization and drawing different types of Marketing diagrams and graphs, including Branding Strategies Diagram, Five Forces Model Diagram, Decision Tree Diagram, Puzzle Diagram, Step Diagram, Process Chart, Strategy Map, Funnel Diagram, Value Chain Diagram, Ladder of Customer Loyalty Diagram, Leaky Bucket Diagram, Promotional Mix Diagram, Service-Goods Continuum Diagram, Six Markets Model Diagram, Sources of Customer Satisfaction Diagram, etc. Analyze effectively the marketing activity of your company and apply the optimal marketing methods with ConceptDraw DIAGRAM software.

block diagram, function blocks Block Diagrams

block diagram, function blocks
Block diagrams solution extends ConceptDraw DIAGRAM software with templates, samples and libraries of vector stencils for drawing the block diagrams.

Cross-Functional Flowchart

Use of Cross-Functional Flowchart is a clear way of showing each team member’s responsibilities and how processes get shared or transferred between different responsible people, teams and departments. Use the best flowchart maker ConceptDraw DIAGRAM with a range of standardized cross-functional flowchart symbols to create the Cross-Functional Flowcharts simply and to visualize the relationship between a business process and the functional units responsible for that process. To draw the most quickly Cross-Functional Flowcharts, Cross Functional Process Maps, or Cross Functional Process Flow Diagrams, start with a Cross-functional flowchart samples and templates from ConceptDraw Solution Park. The ConceptDraw Arrows10 and RapidDraw technologies will be also useful for you in drawing. ConceptDraw DIAGRAM supports designing both types - horizontal and vertical Cross-functional flowcharts. A vertical layout makes the accents mainly on the functional units while a horizontal layout - on the process. If you need a Visio alternative in Mac OS X, try ConceptDraw DIAGRAM. Its interface is very intuitive and it’s actually much easier to use than Visio, yet somehow it’s just as powerful if not more so. ConceptDraw DIAGRAM performs professional quality work and seamless Visio interaction.
How to Draw a Cross Functional Flowchart using visio alternative ConceptDraw DIAGRAM as visio for mac

Process Flowchart

The main reason of using Process Flowchart or PFD is to show relations between major parts of the system. Process Flowcharts are used in process engineering and chemical industry where there is a requirement of depicting relationships between major components only and not include minor parts. Process Flowcharts for single unit or multiple units differ in their structure and implementation. ConceptDraw DIAGRAM is Professional business process mapping software for making Process flowcharts, Process flow diagram, Workflow diagram, flowcharts and technical illustrations for business documents and also comprehensive visio for mac application. Easier define and document basic work and data flows, financial, production and quality management processes to increase efficiency of your business with ConcepDraw DIAGRAM. Business process mapping software with Flowchart Maker ConceptDraw DIAGRAM includes extensive drawing tools, rich examples and templates, process flowchart symbols and shape libraries, smart connectors that allow you create the flowcharts of complex processes, process flow diagrams, procedures and information exchange. Process Flowchart Solution is project management workflow tools which is part ConceptDraw Project marketing project management software. Drawing charts, diagrams, and network layouts has long been the monopoly of Microsoft Visio, making Mac users to struggle when needing such visio alternative like visio for mac, it requires only to view features, make a minor edit to, or print a diagram or chart. Thankfully to MS Visio alternative like ConceptDraw DIAGRAM software, this is cross-platform charting and business process management tool, now visio alternative for making sort of visio diagram is not a problem anymore however many people still name it business process visio tools.
How To Create a Process Flow Chart (business process modelling techniques)

Decision Making Software For Small Business

A software tool that saves your time on making decisions now has the ability to make decisions with remote team via Skype.

site plan, landscape design plan Site Plans

site plan, landscape design plan
The Site Plans solution extends ConceptDraw DIAGRAM with samples, templates and numerous libraries of design elements making it powerful site plan software, ideal for landscape drawing, designing Site Plans, Site Layout Plans, Landscape Design Drawings, Home Site Plans, Hotel Site Plans, Park Site Plans, for developing the residential and commercial landscape design drawings and site plan, parks planning, landscaping territories, lighting trails, for creating drainage facilities, yard layouts, plant maps, outdoor recreational facilities, and irrigation systems plans.