How to Create Presentation of Your Project Gantt Chart
During the planning, discussing and execution of a project you may need to prepare a presentation using project views such as the Gantt Chart, Multiproject Dashboard or Resource Usage View. It’s easy do with ConceptDraw PROJECT!How to do presentation of Mind Maps via Skype conference call?
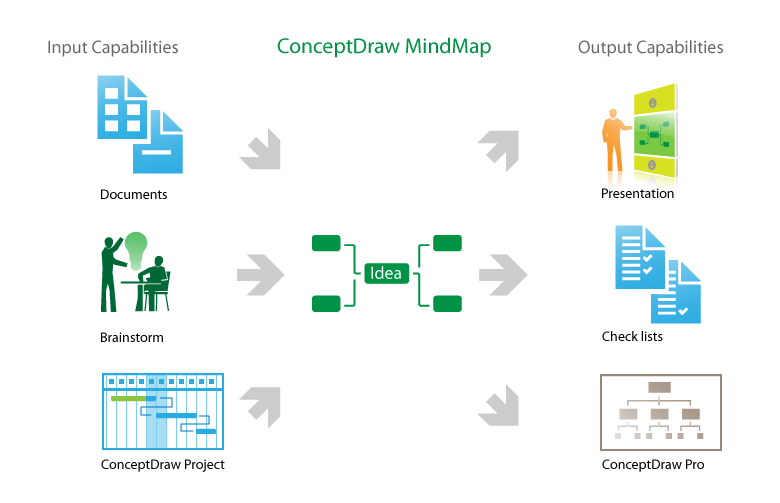
ConceptDraw MINDMAP is powerful and multifunctional mind mapping software with wide variety of relevant features, which make it comfortable for brainstorming, generating ideas, creating beautiful and professional-looking Mind Maps. ConceptDraw MINDMAP provides wide importing and exporting capabilities to variety of formats, among them MS PowerPoint, MS Word, MS Excel, FreeMind, XMind, MindJet Mindmanager, HTML, PDF, graphical formats. An innovative Skype conference call feature deserves the special attention of users, it is useful for teams, it lets to hold the presentations of Mind Maps via Skype and to collaborate in active Skype call. But how to do the presentation of Mind Map via Skype conference call by means of ConceptDraw MINDMAP software? Simply make the Skype conference call, share the presentation via Skype for active call participants using the Remote Presentation for Skype solution, keep the presentation file synchronized between all participants of Skype call. ConceptDraw MINDMAP lets also edit a Mind Map and to do slide show again with no interruption a call.
 Basic Picture Graphs
This solution extends the capabilities of ConceptDraw PRO v10.3.0 (or later) with templates, samples and a library of vector stencils for drawing Picture Graphs.
What Is a Picture Graph?
What is a Picture Graph? It's one of the most useful way which allows explain the information, statistical data in a visual form using the pictures. ConceptDraw PRO extended with Picture Graphs solution from the Graphs and Charts area offers you the easiest way of Picture Graphs drawing.Pictures of Graphs
ConceptDraw PRO diagramming and vector drawing software extended with Picture Graphs solution from the Graphs and Charts Area is the best choice for making professional looking pictures of graphs and colorful picture graphs.Export from ConceptDraw MINDMAP to PowerPoint® Presentation
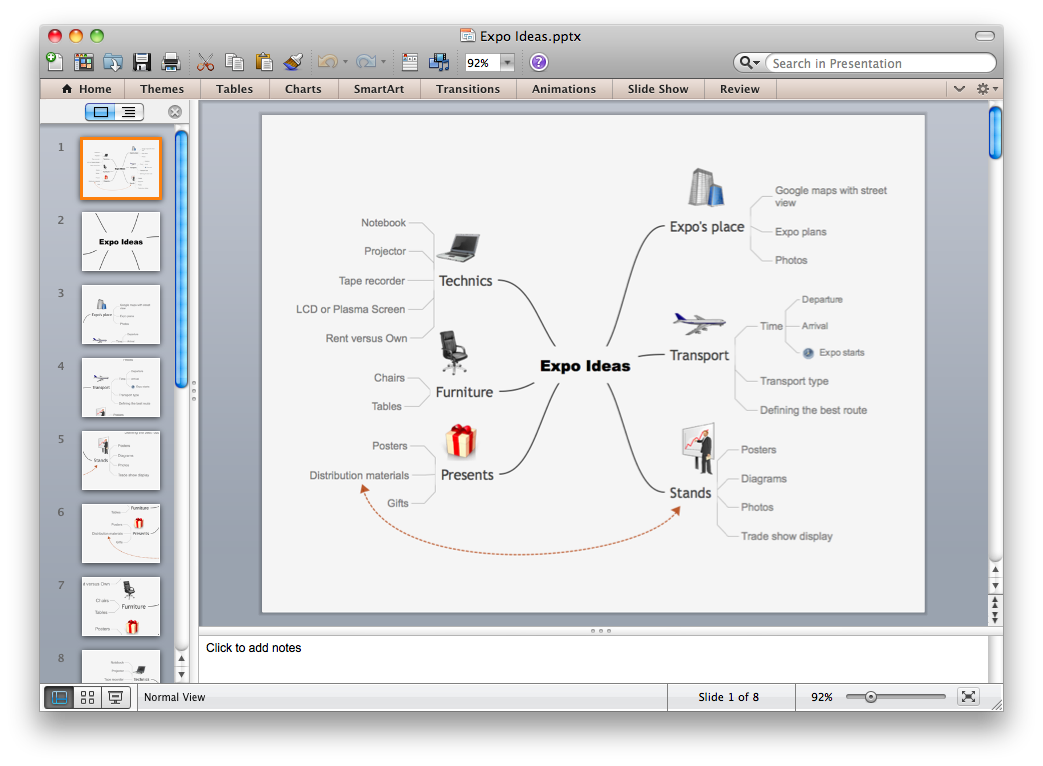
ConceptDraw MINDMAP extended with Presentation Exchange solution allows you to create a traditional PowerPoint Presentation from your mind maps.
to MS PowerPoint
Chart Maker for Presentations
Easy charting software comes with beautiful chart templates and examples. This makes it easy to create professional charts without prior experience.
 Picture Graphs
Typically, a Picture Graph has very broad usage. They many times used successfully in marketing, management, and manufacturing. The Picture Graphs Solution extends the capabilities of ConceptDraw PRO v10 with templates, samples, and a library of professionally developed vector stencils for designing Picture Graphs.
Sales Growth. Bar Graphs Example
This sample was created in ConceptDraw PRO diagramming and vector drawing software using the Bar Graphs Solution from Graphs and Charts area of ConceptDraw Solution Park. It is Bar Graphs example, Sales Growth example, Column Chart Example - Sales Report.Chart Software for Better Presentations
Easy charting software comes with beautiful chart templates and examples. This makes it easy to create professional charts without prior experience. Graphs and Charts Area provide a wide collection of professional looking predesigned templates, samples and ready-to-use vector stencils that will help you to draw the charts and diagrams of various types: Pie Charts, Donut Charts, Line Charts, Column Charts, Bar Charts, Pyramids, Scatter Charts, Venn Diagrams, Spider Charts, Area Charts, Divided Bar Graphs.- Powerpoint Charts And Graphs
- A Picture Of Presentation Building Plan
- Microsoft Office Gantt Chart Template
- Online Graph Creator For Presentation
- Line Chart Template for Word | Chart Maker for Presentations ...
- Images Of Simple Drawing Business Building
- Polar Graph | Export from ConceptDraw MINDMAP to PowerPoint ...
- Atmosphere air composition | Percentage Pie Chart . Pie Chart ...
- How to Create Presentation of Your Project Gantt Chart | Export from ...
- Chart Maker for Presentations | Rainfall Bar Chart | Picture Graphs ...


