HelpDesk
How to Draw a Pie Chart Using ConceptDraw PRO
A pie chart represents data, in a clear and easy to read round (pie) form. A circular pie chart is divided into sections (slice). Each "slice" depicts the It reflects the proportion of each component in the whole "pie". This type of chart is most often used for the visualization of statistical data. That is why pie charts are widely used in marketing. As pie charts show proportional proportional parts of a whole, they are good for various visual comparisons. For example, it is difficult to imagine a more intuitive way to show segmentation and market share. ConceptDraw PRO allows you to draw a simple and clear Pie Chart using the Pie Charts solution.HelpDesk
How to Draw the Different Types of Pie Charts
Using the Pie Chart, you can visually estimate the relative contribution that different data categories contribute to a whole value. The pie chart displays the statistics in a visual format. The main use of pie charts to show comparisons. The larger piece of the pie, the more the value of this value compared to the rest. Various applications of pie charts can be found in business and education. For business, pie charts can be used to compare the success or failure of the goods or services. They may also be used to display the business market share.HelpDesk
How To Create a PERT Chart
Project Evaluation and Review Technique (PERT) is a method of project tasks evaluation and analysis. PERT - is a method of analyzing the tasks required to complete the project. It includes analysis of the time required to complete each task, as well as the determination of the time required to carry out the whole project. PERT was developed to facilitate the planning of huge and complex projects. PERT is used for very large, complex, and non-standard projects. Technology implies the presence of uncertainty, making it possible to develop a schedule of the project without a precise information on details and time required for all of its components. The most popular part of PERT is a method of the critical path, based on the construction of the network schedule (PERT network diagram). ConceptDraw Office delivers you the best way to create PERT chart for your project using compatibility between ConceptDraw PROJECT and ConceptDraw PRO.HelpDesk
How to Create a Gantt Chart for Your Project
Instruction on how to create Gantt chart using ConceptDraw PROJECT software. Gant Chart is a graphical representation of tasks as segments on a time scale. It helps plan or overlapping.HelpDesk
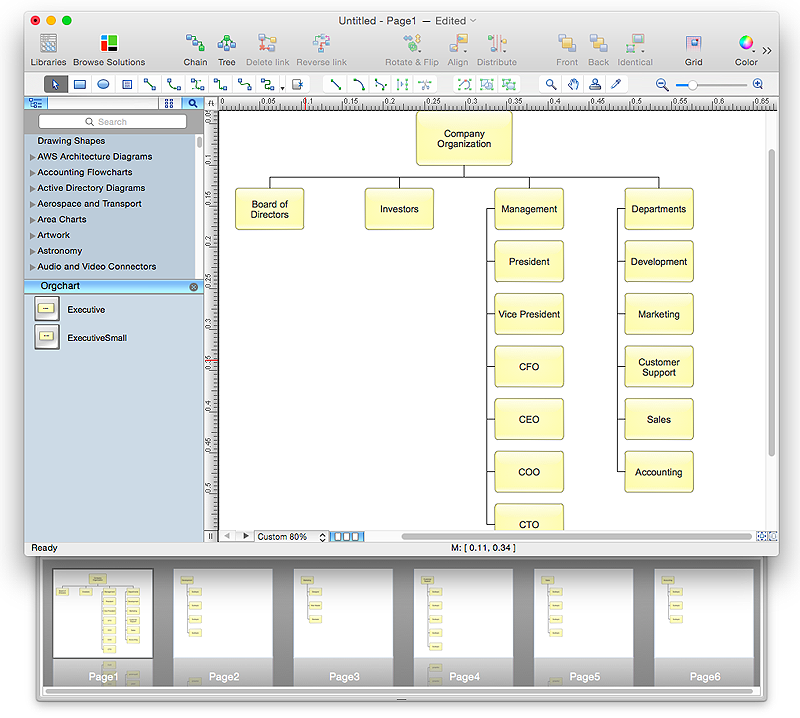
How to Create Organizational Chart Quickly
Use ConceptDraw MINDMAP for generating structured data on organization structure and then ConceptDraw PRO for presenting the results as chart.HelpDesk
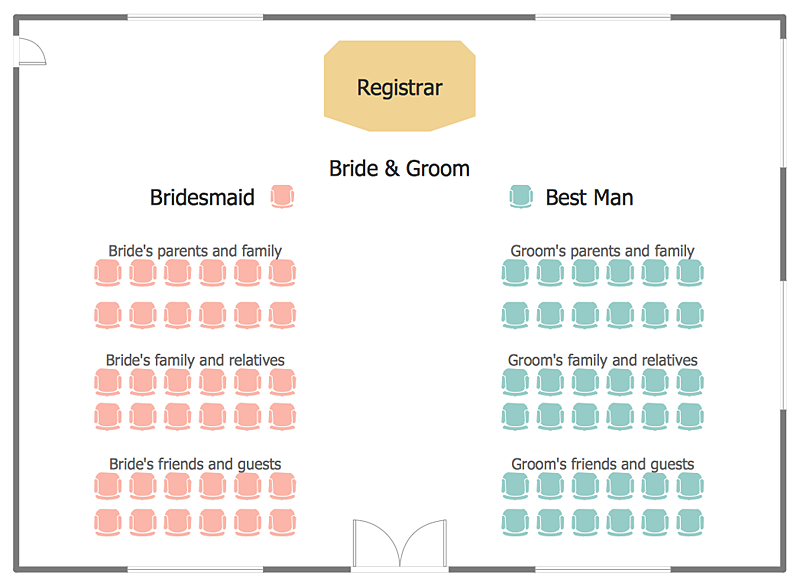
How to Create a Seating Chart for Wedding or Event
Making the guests invited to a wedding or any other special event feel as comfortable as possible, you necessary to take care of the preparation of the seating arrangements plan. That is why it is important to make a detailed table seating chart that will carefully positioning any invitee. Making a Seating Chart template with a help of seating chart software is the best way to represent and prepare a seating plan, for event participants and guests. The ability to design different seating plans is delivered by the ConceptDraw Seating Plans solution. Using ConceptDraw PRO simplifies the complex and cumbersome process of public events organization.HelpDesk
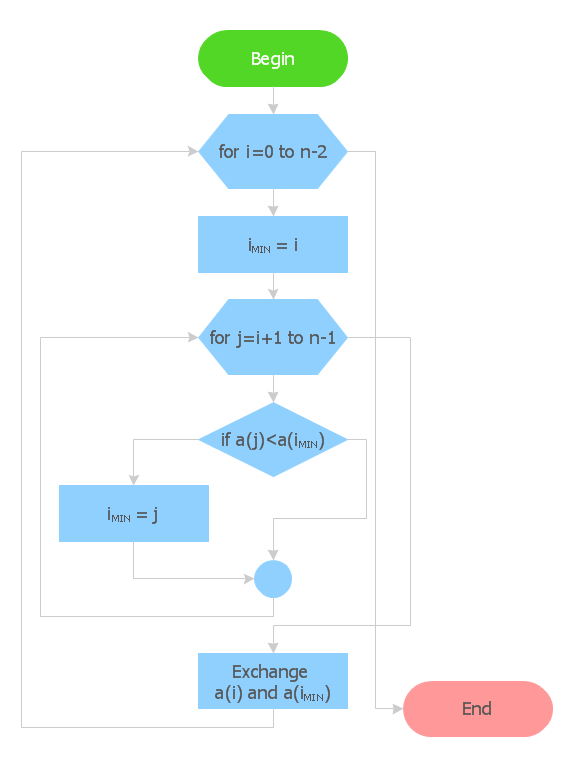
How to Create Flowchart Using Standard Flowchart Symbols
Flowcharts are used to display an algorithm for consistent execution of certain steps. Flowchart is probably the easiest way to make a graphical representation of any process. Flowcharts use the set of standard geometric symbols and arrows to define relationships. ConceptDraw PRO allows you to create professional flowchart quickly and easily. The ability to create flowcharts is contained in the Flowcharts solution. The solution provides a set of special tools for creating flowcharts.- Create Flow Chart on Mac
- How to Create Organizational Chart Quickly | How to Draw an ...
- Create Flow Chart on Mac | Process Flow app for Mac | Flowchart ...
- Create Graphs and Charts | Selecting & Creating Flowcharts ...
- Simple Flow Chart | Basic Flowchart Symbols and Meaning ...
- Create Flow Chart on Mac | Cross-Functional Flowchart | Flow ...
- Process Flowchart | Create Flow Chart on Mac | Cross-Functional ...
- Create Graphs and Charts | Best Diagramming Software for Mac ...
- How to Create a HR Process Flowchart Using ConceptDraw PRO ...
- Create Flow Chart on Mac | Workflow Diagram Software Mac ...
- How to Draw an Organization Chart | How to Create Organizational ...
- How to Draw an Organization Chart | ConceptDraw PRO ...
- How to Draw an Organization Chart | Organizational Charts | How to ...
- Basic Flowchart Symbols and Meaning | Audit Flowchart Symbols ...
- How to Draw an Organization Chart | Orgchart | Create ...
- How to Draw a Gantt Chart Using ConceptDraw PRO | How to Draw ...
- Creating Flow Chart For The Solution To A Software Development
- Marketing Flow Chart
- How To Create a Bubble Chart | Best Diagramming Software for Mac ...


