Easy Flowchart Program and Standard Flowchart Symbols
Fast visualization of structured data is main capability of the ConceptDraw DIAGRAM. With numerous vector stencils and standard flowchart symbols from object libraries and the RapidDraw technology this program stands as the best professional flowchart software for drawing with type of flowchart symbols. ConceptDraw DIAGRAM also known as best flowchart maker.Onion Diagram Process Design
Onion diagram is a type of circular diagram that consists of the core circle representing the product/solution and concentric circles around it, which dependent on the core and look like the cross sections of onion. ConceptDraw DIAGRAM diagramming and vector drawing software supplied with Stakeholder Onion Diagrams Solution from the Management Area of ConceptDraw Solution Park is an ideal software for effective Onion diagram process design.Onion Diagram Maker
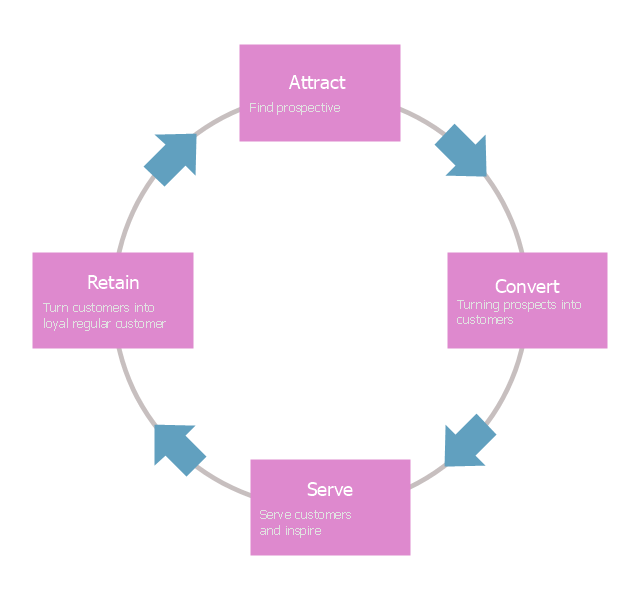
The onion diagram is a type of diagram which shows the dependencies among parts of an organization or process. The items are displayed at the concentric circles, where the items at the bigger rings depend on the items at the smaller rings. ConceptDraw DIAGRAM diagramming and vector drawing software extended with Stakeholder Onion Diagrams Solution from the Management Area of ConceptDraw Solution Park is a professional Onion Diagram Maker.This arrow circle diagram sample was redesigned from the Wikimedia Commons file: Loyalitätskreislauf-klein.jpg. [commons.wikimedia.org/ wiki/ File:Loyalit%C3%A4tskreislauf-klein.jpg]
This file is licensed under the Creative Commons Attribution-Share Alike 3.0 Unported license. [creativecommons.org/ licenses/ by-sa/ 3.0/ deed.en]
"Loyalty marketing is an approach to marketing, based on strategic management, in which a company focuses on growing and retaining existing customers through incentives. Branding, product marketing and loyalty marketing all form part of the customer proposition - the subjective assessment by the customer of whether to purchase a brand or not based on the integrated combination of the value they receive from each of these marketing disciplines.
The discipline of customer loyalty marketing has been around for many years...
In recent years, a new marketing discipline called "customer advocacy marketing" has been combined with or replaced "customer loyalty marketing." " [Loyalty marketing. Wikipedia]
The arrow circle diagram example "Loyalty" was created using the ConceptDraw PRO diagramming and vector drawing software extended with the Target and Circular Diagrams solution from the Marketing area of ConceptDraw Solution Park.
www.conceptdraw.com/ solution-park/ marketing-target-and-circular-diagrams
This circle diagram sample was redesigned from the Wikimedia Commons file: Research cycle.png. "Some of the basic elements of the scientific method, arranged in a cycle to emphasize that it is an iterative process." [commons.wikimedia.org/ wiki/ File:Research_ cycle.png]
This file is licensed under the Creative Commons Attribution 2.0 Generic license. [creativecommons.org/ licenses/ by/ 2.0/ deed.en]
"The scientific method is a body of techniques for investigating phenomena, acquiring new knowledge, or correcting and integrating previous knowledge. To be termed scientific, a method of inquiry must be based on empirical and measurable evidence subject to specific principles of reasoning. ...
Four essential elements of the scientific method are iterations, recursions, interleavings, or orderings of the following:
(1) Characterizations (observations, definitions, and measurements of the subject of inquiry).
(2) Hypotheses (theoretical, hypothetical explanations of observations and measurements of the subject).
(3) Predictions (reasoning including logical deduction from the hypothesis or theory).
(4) Experiments (tests of all of the above)...
A linearized, pragmatic scheme of the four points above is sometimes offered as a guideline for proceeding:
(1) Define a question.
(2) Gather information and resources (observe).
(3) Form an explanatory hypothesis.
(4) Test the hypothesis by performing an experiment and collecting data in a reproducible manner.
(5) Analyze the data.
(6) Interpret the data and draw conclusions that serve as a starting point for new hypothesis.
(7) Publish results.
(8) Retest (frequently done by other scientists).
The iterative cycle inherent in this step-by-step method goes from point 3 to 6 back to 3 again." [Scientific method. Wikipedia]
The circle diagram example "Research cycle" was created using the ConceptDraw PRO diagramming and vector drawing software extended with the Target and Circular Diagrams solution from the Marketing area of ConceptDraw Solution Park.
www.conceptdraw.com/ solution-park/ marketing-target-and-circular-diagrams
HelpDesk
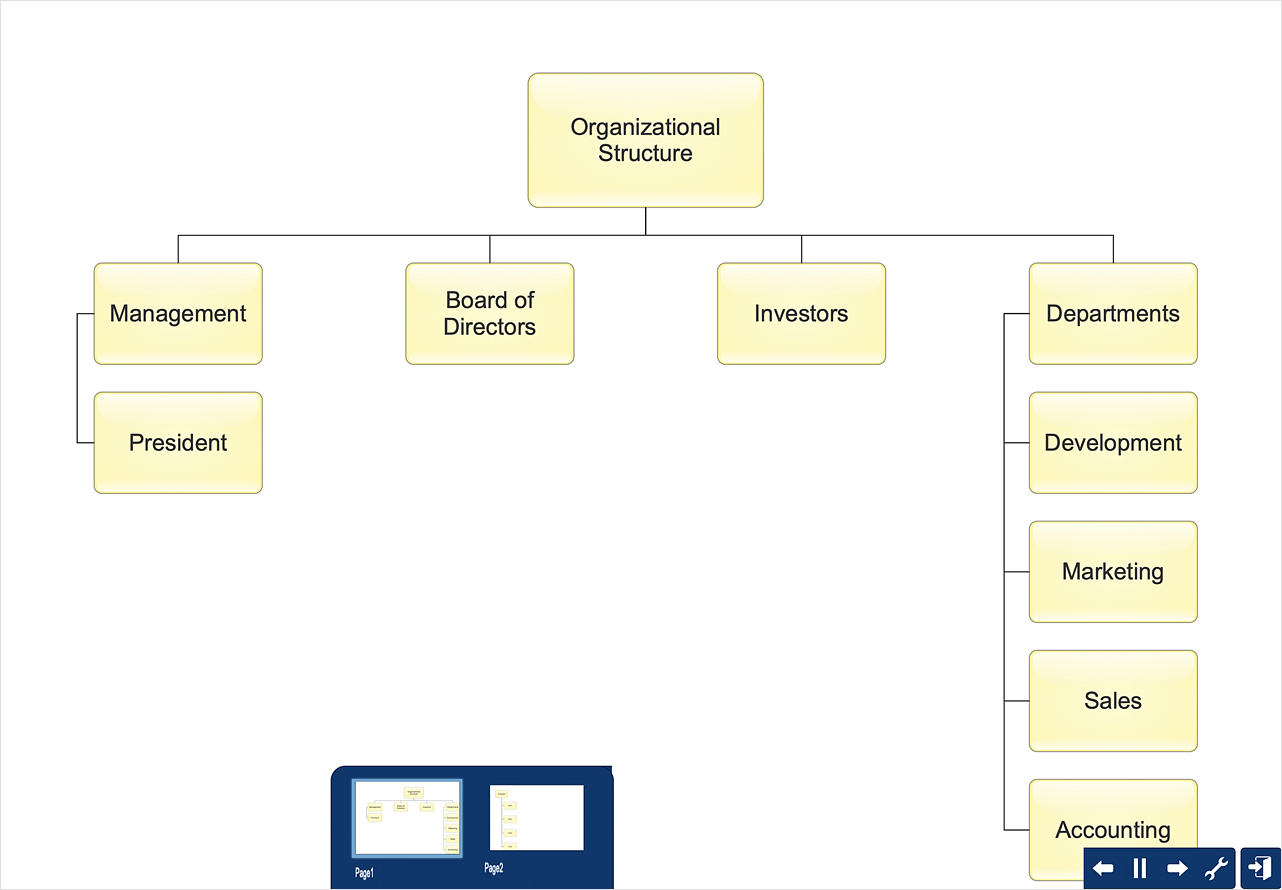
How to Create Organizational Chart Quickly
Use ConceptDraw MINDMAP for generating structured data on organization structure and then ConceptDraw DIAGRAM for presenting the results as chart.The vector stencils library "Application" contains 40 icons of software applications.
Use it to design your computer and telecom illustrations and infographics with ConceptDraw PRO diagramming and vector drawing software.
The vector stencils library "Application" is included in the Computers and Communications solution from the Illustration area of ConceptDraw Solution Park.
Use it to design your computer and telecom illustrations and infographics with ConceptDraw PRO diagramming and vector drawing software.
The vector stencils library "Application" is included in the Computers and Communications solution from the Illustration area of ConceptDraw Solution Park.
Stakeholder Mapping Tool
Stakeholders are the groups of people or organizations whose contribution matters to the organization's success, this can be labour participation, financial participation, dissemination of information about organization, etc. So, the employees of the company, its suppliers, customers, media, public organizations, state authorities, all they are stakeholders of the company. ConceptDraw DIAGRAM diagramming and vector drawing software extended with Stakeholder Onion Diagrams Solution from the Management Area of ConceptDraw Solution Park is a powerful stakeholder mapping tool which allows easy create Stakeholder Onion diagrams and maps depicting the layers of a project, relationships of stakeholders to a project goal, and relationships between stakeholders.HelpDesk
How to Use Basic Floor Plans Solution
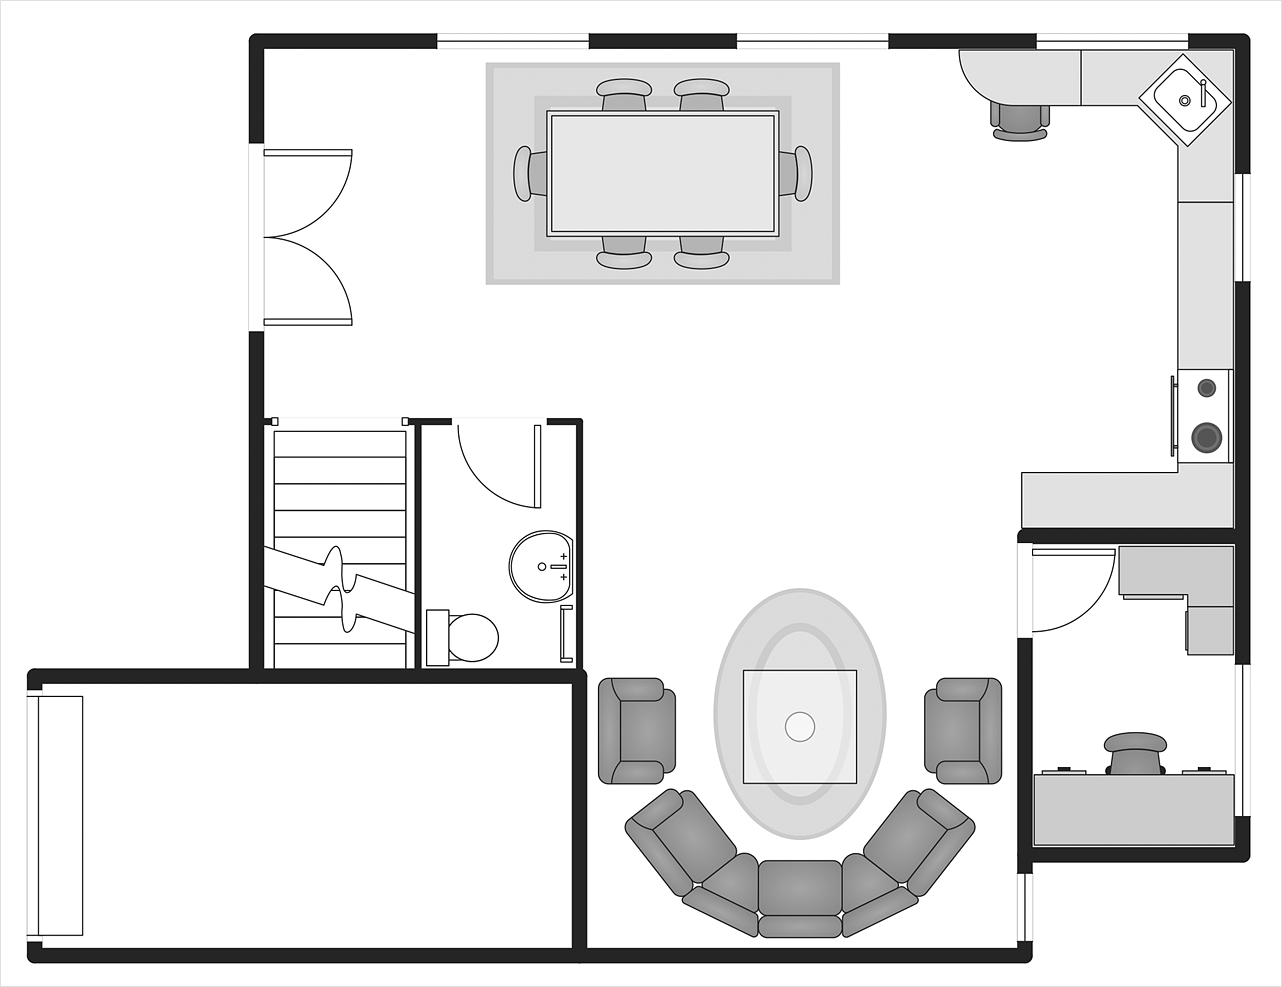
Making a home or apartment floor plans involves many different elements that can be managed using ConceptDraw DIAGRAM. The ability to design different floor plans is delivered by the Floor Plans solution. Using this solution you can easily create and communicate floor plans of any complexity.Interior Design. Office Layout Plan Design Element
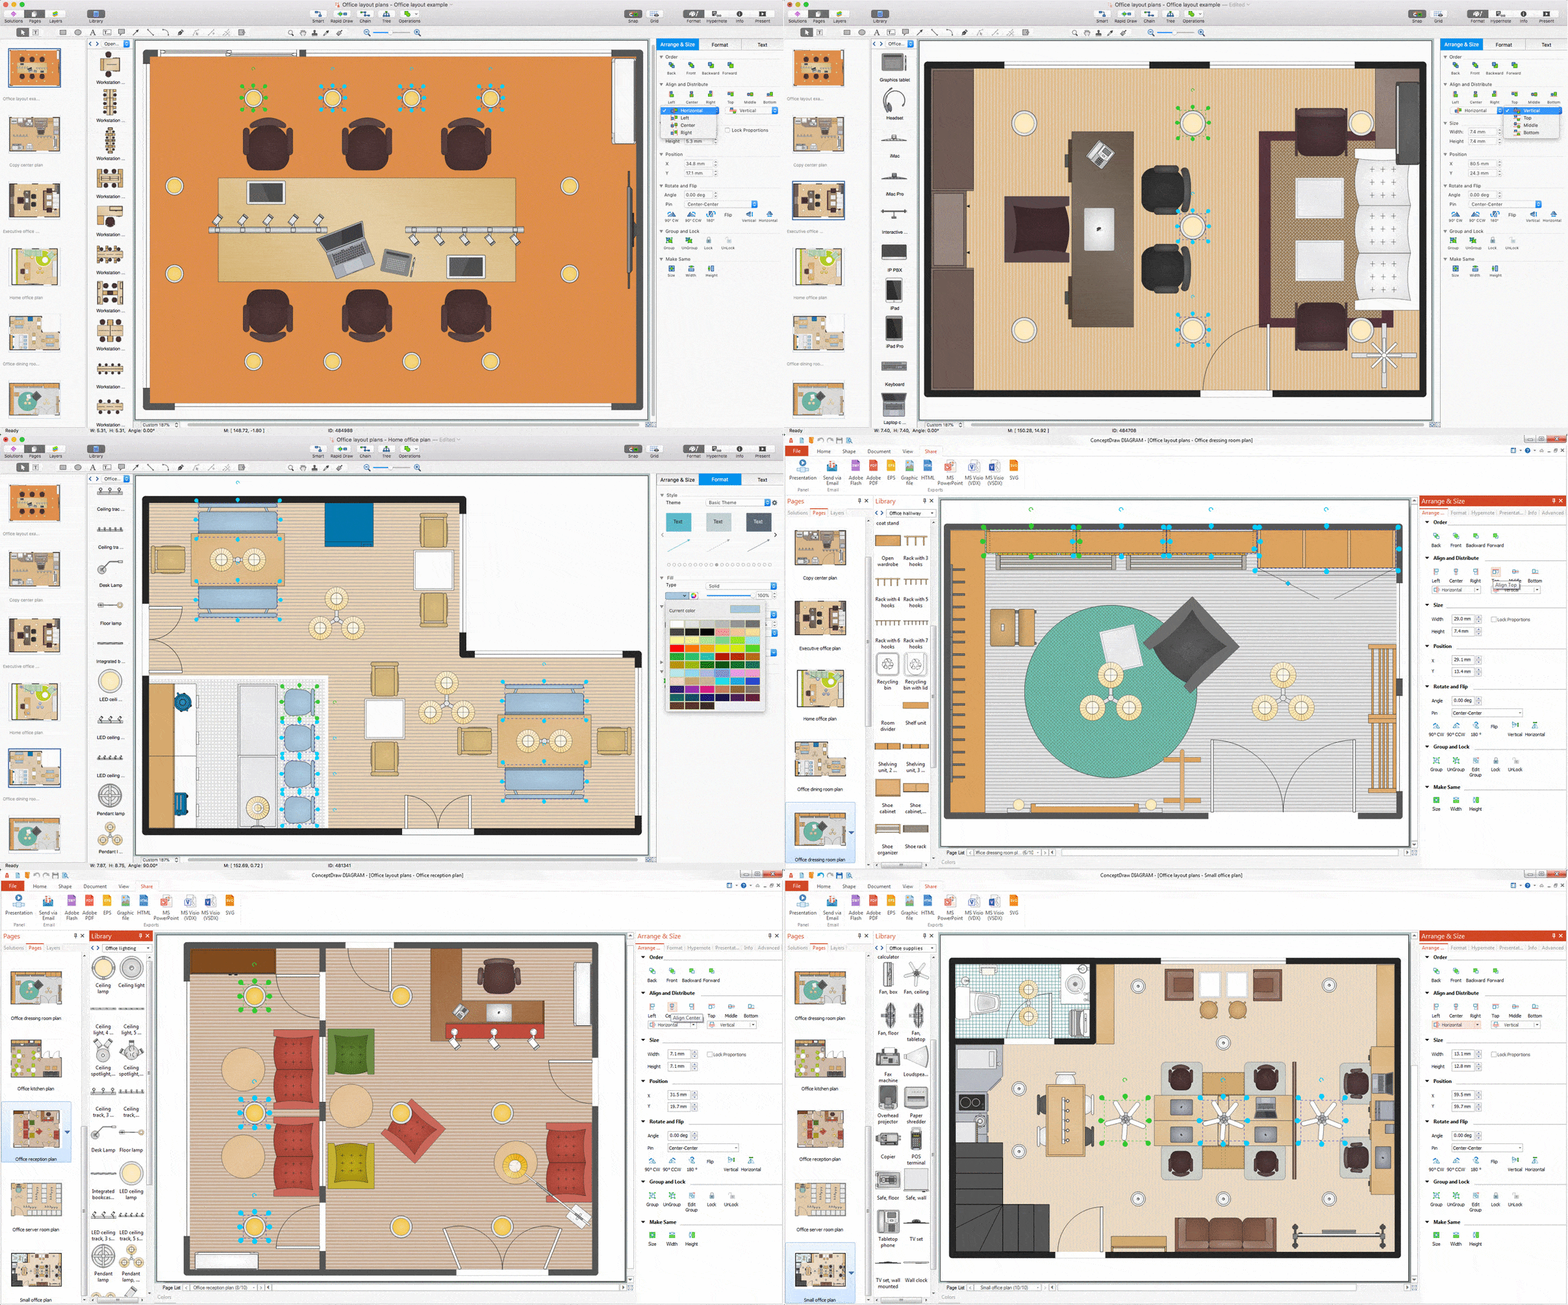
Lucky interior design is an integral part of succesful work at office. The important challenge in office design planning is to find a balance between two main office activities: concentration and communication. Primarily you need to determine with a type of office space, this can be an open space or separate rooms. The first type is more suitable for communication and rapid interaction. That's why open offices and combined spaces are modern types of work space and often used, especially for private offices. Traditional office basically represents separate rooms arranged along the corridor. It is applied for the companies with small number of people or for enterprises divided on separate departments, and is practically inapplicable for teamwork. ConceptDraw DIAGRAM diagramming and vector drawing software extended with Office Layout Plans solution offers a lot of vector stencils libraries with design elements of office furniture and equipment for effective office interior design and office space planning, for easy creation Office Floor Plans and Office Layout Plans. Use ConceptDraw DIAGRAM to visualize process flowcharts, network architecture and program workflows like Visio for Mac and even more. The software can be used with different fields like business, engineering and construction, etc.
Tools to Create Your Own Infographics
Over the past few centuries, data visualization has evolved so much that we use it every day in all areas of our lives. Many believe that infographic is an effective tool of storytelling, as well as analytics, and that it is able to overcome most of the language and educational barriers. Understanding the mechanisms of human perception will help you to understand how abstract forms and colors used in data visualization can transmit information more efficient than long paragraphs of text.Samples of Flowchart
This sample shows the Flowchart of the testing the work of the lamp and decision making about what to do to lamp will work.Stakeholder Onion Diagrams
The Stakeholder Onion Diagram is a popular and widely used way to view the relationships of stakeholders to a project goal. The Onion Diagram focuses on the project goal, most of other diagram styles focus on the project, stakeholders, and timeline. This difference favorably distinguishes and separates the Onion Diagram from other types of diagrams. Design fast and easy Stakeholder Onion Diagrams of any complexity in ConceptDraw DIAGRAM diagramming and vector drawing software using the powerful tools of Stakeholder Onion Diagrams Solution from the Management Area of ConceptDraw Solution Park.
 Office Layout Plans
Office layouts and office plans are a special category of building plans and are often an obligatory requirement for precise and correct construction, design and exploitation office premises and business buildings. Designers and architects strive to make office plans and office floor plans simple and accurate, but at the same time unique, elegant, creative, and even extraordinary to easily increase the effectiveness of the work while attracting a large number of clients.
- Venn Diagram Template | 3 Circle Venn Diagram. Venn Diagram ...
- Ladder of customer loyalty diagram | Loyalty - Arrow circle diagram ...
- 5 Arrow Circle Vector Ppt
- Vector Arrow Circle
- Arrow circle chart - Template | Circular diagrams - Vector stencils ...
- Research cycle - Circle diagram | Circular diagrams - Vector stencils ...
- Research cycle - Circle diagram | Process Flowchart | Network ...
- Circle -spoke diagram - Vector stencils library | Circular diagrams ...
- Circle -spoke diagram - Vector stencils library | Circular diagrams ...
- Water cycle diagram | Research cycle - Circle diagram | Process ...
- Loyalty - Arrow circle diagram | Basic Flowchart Symbols and ...
- Circular diagrams - Vector stencils library | 3 Circle Venn Diagram ...
- Circular diagrams - Vector stencils library | Loyalty - Arrow circle ...
- Circular Diagram
- Circle Diagrams | Research cycle - Circle diagram | Lifecycle of an ...
- Marketing Diagrams | Virtuous circle (management) - Ring chart ...
- Circular Arrows Diagrams | Circular diagrams - Vector stencils ...
- Circle Spoke Diagram Template | Circular Flow Diagram Template ...
- Pyramid Diagram | Presentation design elements - Vector clipart ...
- Arrow circle chart - Template | Circular diagrams - Vector stencils ...


