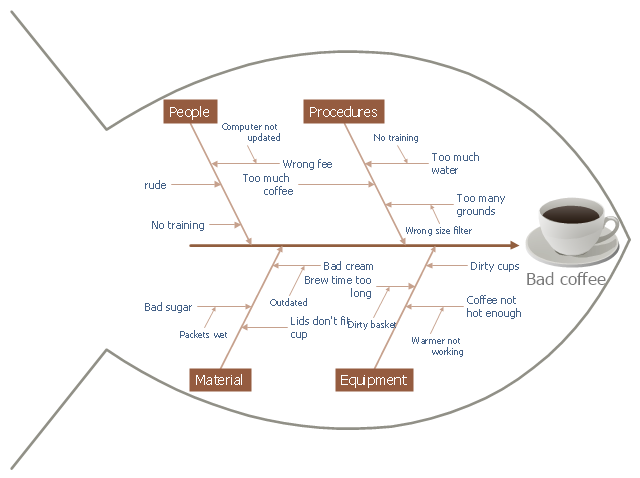
This cause and effect diagram sample was redesigned from the Wikimedia Commons file: Fishbone BadCoffeeExample.jpg. [commons.wikimedia.org/ wiki/ File:Fishbone_ BadCoffeeExample.jpg]
This file is licensed under the Creative Commons Attribution-Share Alike 3.0 Unported license. [creativecommons.org/ licenses/ by-sa/ 3.0/ deed.en]
The fishbone diagram example "Bad coffee" was created using the ConceptDraw PRO diagramming and vector drawing software extended with the Fishbone Diagrams solution from the Management area of ConceptDraw Solution Park.
Total Quality Management with ConceptDraw
Total Quality Management (TQM) system is the management method where the confidence in quality of all organization processes is placed foremost. The given method is widely used in production, in educational system, in government organizations and so on.
 Quality
This solution extends ConceptDraw PRO v9 and ConceptDraw MINDMAP v7 with Quality Management Diagrams (Total Quality Management Diagrams, Timelines, Workflows, Value Stream Maps) and Mind Maps (Presentations, Meeting Agendas, Problem to be solved).
Project —Task Trees and Dependencies
Users new to ConceptDraw PROJECT will find the Basic lessons an essential platform for familiarizing themselves with the program′s functions. This video lesson will teach you how to set up task trees and dependencies.
 PM Response
This solution extends all ConceptDraw Office 2.0 products by helping to improve the response time to project changes. PM Response also helps with iteration planning, discussing project layout approaches, and solving project challenges.
 Quality Mind Map
This solution extends ConceptDraw MINDMAP software with Quality Management Mind Maps (Presentations, Meeting Agendas, Problem to be solved).
 Project Management Area
Project Management area provides Toolbox solutions to support solving issues related to planning, tracking, milestones, events, resource usage, and other typical project management functions.
- Fishbone Diagram | Cause and Effect Diagram | Fishbone diagram ...
- Using Fishbone Diagrams for Problem Solving | Cause and Effect ...
- Fishbone Diagram | Business Productivity Diagramming | Using ...
- Fishbone Diagram | Cause and Effect Diagram | Fishbone Diagram ...
- Fishbone diagram - Template | Design elements - Cause-and-effect ...
- Fishbone Diagram | Business Productivity Diagramming | Fishbone ...
- Fishbone Diagram
- Fishbone Diagram | Business Productivity Diagramming | Cause ...
- Seven Basic Tools of Quality - Fishbone Diagram | Fishbone ...
- Process Flowchart | A Creative Look at Quality Procedures ...
- Process Flowchart | A Creative Look at Quality Procedures | Quality ...
- Using Fishbone Diagrams for Problem Solving | Fishbone Diagram ...
- Fishbone Diagram | Use a Fishbone Diagram to Attack Complex ...
- Fishbone Diagram | Business Productivity Diagramming | Cause ...
- Fishbone Diagram | Business Productivity Diagramming | How to ...
- Examples of Reed-Kellogg diagrams | Creative Sentence Structure
- Ishikawa fishbone diagram | Fishbone diagram - Bad coffee | Cause ...
- Total Quality Management Value | Mind Mapping in the Quality ...
- Fishbone diagram - Bad coffee | Cause and effect diagram ...
- Cause and Effect Analysis ( Fishbone Diagrams) | Cause and Effect ...


