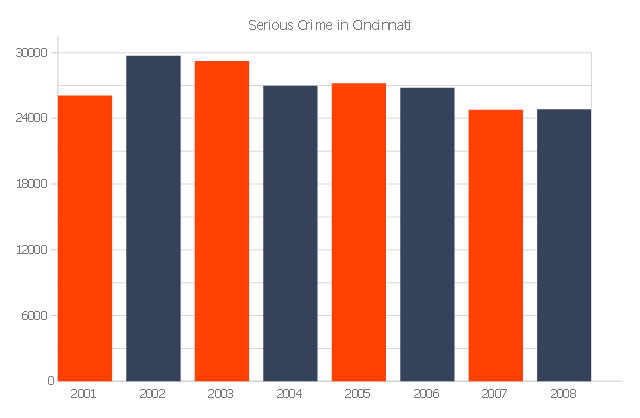
The vertical bar graph sample shows the serious crime number in Cincinnati from 2001 to 2008. It was designed on the base of the Commons Wikimedia file: Cincinnati-Part-1-Crimes.jpg.
[commons.wikimedia.org/ wiki/ File:Cincinnati-Part-1-Crimes.jpg]
"Before the riot of 2001, Cincinnati's overall crime rate was dropping dramatically and had reached its lowest point since 1992. After the riot violent crime increased. Reflecting national trends, crime rates in Cincinnati have dropped in all categories from 2006 to 2010." [Crime in Cincinnati. Wikipedia]
The column chart example "Serious crime in Cincinnati" was created using the ConceptDraw PRO diagramming and vector drawing software extended with the Bar Graphs solution from the Graphs and Charts area of ConceptDraw Solution Park.
Column Chart Examples
Column chart examples from ConceptDraw collection can help you find the best visual depiction for you data. You can easily modify column chart examples according to data you want to visualize.
 Bar Graphs
The Bar Graphs solution enhances ConceptDraw PRO v10 functionality with templates, numerous professional-looking samples, and a library of vector stencils for drawing different types of Bar Graphs, such as Simple Bar Graph, Double Bar Graph, Divided Bar Graph, Horizontal Bar Graph, Vertical Bar Graph, and Column Bar Chart.
Column Chart Template
Column chart templates from ConceptDraw collection can help you find the best visual depiction for you data. You can easily modify column chart templates according to data you want to visualize.Chart Examples
Easy charting software comes with beautiful chart templates and examples. This makes it easy to create professional charts without prior experience.How to Create a Bar Chart
The answer how to create a bar chart can be found in ConceptDraw software. The simple tips guide you through the software to quickly learn how to create a bar chart.Chart Templates
Easy charting software comes with beautiful chart templates and examples. This makes it easy to create professional charts without prior experience.Vertical Cross Functional Flowchart
ConceptDraw PRO is a powerful tool that helps you create professional looking cross-functional flowcharts with the well-designed objects. ConceptDraw PRO - Drawing Software for Vertical Cross Functional Flowchart. ConceptDraw allows you to focus on work, not the drawing process. ConceptDraw Arrows10 Technology allows to draw connectors with smart behavior that gives flexibility to you during work process.How to Create a Column Chart
The question how to create a column chart have a simple answer. Use ConceptDraw tips to find out how to create a column chart depicts your data the best way.Business Structure
Each business is created, exists and develops according to its type of business structure. Creating new business or developing existing, you may need a powerful software for representing its business structure. In this case ConceptDraw PRO diagramming and vector drawing software extended with 25 Typical Orgcharts solution from the Management area is exactly what you need.- Chart Examples | Chart Templates | Recent Bar Graph On Crime ...
- Serious crime in Cincinnati | How to Create a Column Chart ...
- Bar Graphs | Serious crime in Cincinnati | Column Chart Examples ...
- Design Bar Chart With Statistics Of Crime
- Chart Maker for Presentations | Serious crime in Cincinnati | Column ...
- Bar Graph | Serious crime in Cincinnati | Bar Diagrams for Problem ...
- Bar Graphs | Bar Graph | Bar Chart Software | How To Graph A ...
- Bar graph - Serious Crime in Cincinnati | How to Create a Column ...
- Bar Graph | Bar Diagrams for Problem Solving. Create ...
- Chart Software for Better Presentations | Bar Graph About The Rain ...
- Bar Graph
- Bar Graphs | Sales Growth. Bar Graphs Example | Bar Graph | Why ...
- Serious crime in Cincinnati | Warehouse security quiz | How to ...
- Bar Graphs | Ice Hockey Rink Dimensions | Bar Graph | Blue Bar ...
- Trend In Column Graph
- Growth Rate Using Bar Graph
- Sales Growth. Bar Graphs Example | Bar Graph | Bar Diagrams for ...
- Bar Graph | Sales Growth. Bar Graphs Example | Rainfall Bar Chart ...
- Bar Graphs Solution


