 Bar Graphs
The Bar Graphs solution enhances ConceptDraw DIAGRAM functionality with templates, numerous professional-looking samples, and a library of vector stencils for drawing different types of Bar Graphs, such as Simple Bar Graph, Double Bar Graph, Divided Bar Graph, Horizontal Bar Graph, Vertical Bar Graph, and Column Bar Chart.
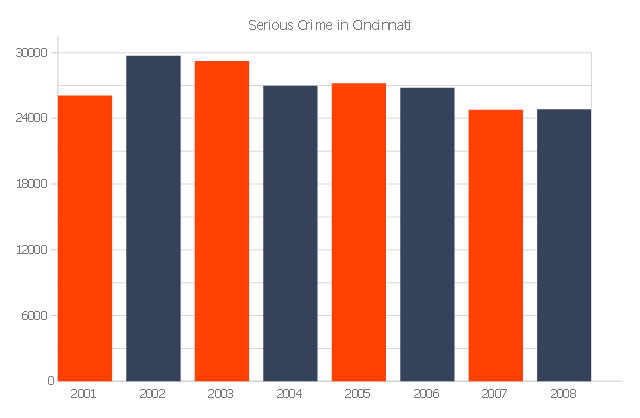
The vertical bar graph sample shows the serious crime number in Cincinnati from 2001 to 2008. It was designed on the base of the Commons Wikimedia file: Cincinnati-Part-1-Crimes.jpg.
[commons.wikimedia.org/ wiki/ File:Cincinnati-Part-1-Crimes.jpg]
"Before the riot of 2001, Cincinnati's overall crime rate was dropping dramatically and had reached its lowest point since 1992. After the riot violent crime increased. Reflecting national trends, crime rates in Cincinnati have dropped in all categories from 2006 to 2010." [Crime in Cincinnati. Wikipedia]
The column chart example "Serious crime in Cincinnati" was created using the ConceptDraw PRO diagramming and vector drawing software extended with the Bar Graphs solution from the Graphs and Charts area of ConceptDraw Solution Park.
Column graph
Column Chart Examples

Chart Examples

How to Create a Column Chart

Column Chart Template

Chart Templates

Bar Charts

Bar Chart Examples

Chart Templates
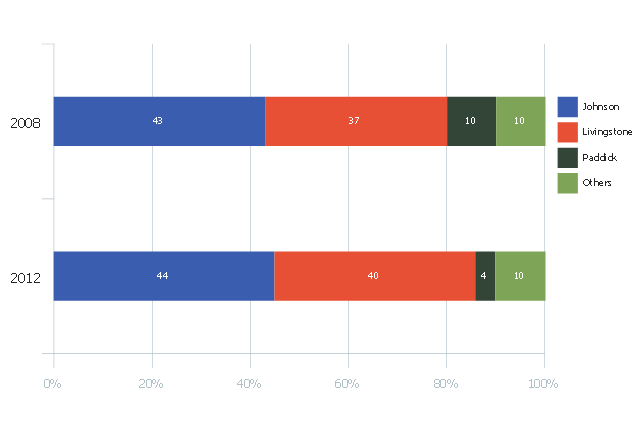
This divided bar diagram sample shows London election results in 2008 and 2012. It was drawn using data from the infographics "London Elections Results by Numbers" on the london.gov.uk website.
[data.london.gov.uk/ datastore/ package/ london-elections-results-2012-wards-boroughs-constituency]
"There are six types of elections in the United Kingdom: United Kingdom general elections, elections to devolved parliaments and assemblies, elections to the European Parliament, local elections, mayoral elections and Police and Crime Commissioner elections. Elections are held on Election Day, which is conventionally a Thursday. General elections do not have fixed dates, but must be called within five years of the opening of parliament following the last election. Other elections are held on fixed dates, though in the case of the devolved assemblies and parliaments early elections can occur in certain situations. Currently, six electoral systems are used: the single member plurality system (First Past the Post), the multi member plurality system, party list PR, the single transferable vote, the Additional Member System and the Supplementary Vote.
Elections are administered locally: in each lower-tier local authority, the actual polling procedure is run by the Returning Officer and the compiling and maintenance of the electoral roll by the Electoral Registration Officer (except in Northern Ireland, where the Electoral Office for Northern Ireland assumes both responsibilities). The Electoral Commission only sets standards for and issues guidelines to Returning Officers and Electoral Registration Officers, but is responsible for nationwide electoral administration (such as the registration of political parties and directing the administration of national referendums)." [Elections in the United Kingdom. Wikipedia]
The chart example "London election results" was created using the ConceptDraw PRO diagramming and vector drawing software extended with the Divided Bar Diagrams solution from the Graphs and Charts area of ConceptDraw Solution Park.
Divided bar chart
Network Security

 Network Security Diagrams
The Network Security Diagrams solution presents a large collection of predesigned cybersecurity vector stencils, cliparts, shapes, icons and connectors to help you succeed in designing professional and accurate Network Security Diagrams, Network Security Infographics to share knowledge about effective ways of networks protection with help of software and network security devices of different cyber security degrees, Network Plans for secure wireless network, Computer Security Diagrams to visually tell about amazing possibilities of IT security solutions. The samples and examples reflect the power of ConceptDraw DIAGRAM software in drawing Network Security Diagrams, give the representation about variety of existing types of attacks and threats, help to realize their seriousness and the methods to deal with them.
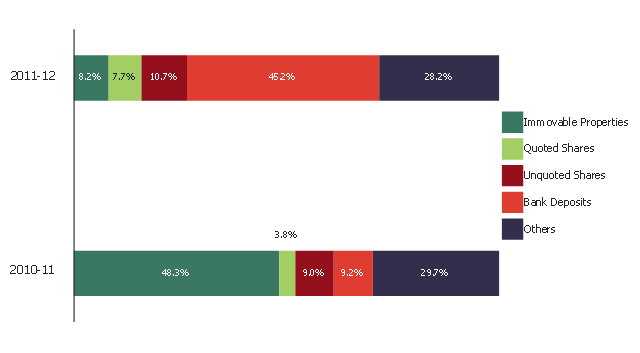
This divided bar diagram sample shows the compisition of estates in 2010-11 and 2011-12. It was created on the base of the figure "Composition of estates" from the website of the Inland Revenue Department of the Government of the Hong Kong Special Administrative Region.
[ird.gov.hk/ dar/ 2011-12/ en/ assessing.html]
"An estate is the net worth of a person at any point in time alive or dead. It is the sum of a person's assets - legal rights, interests and entitlements to property of any kind - less all liabilities at that time. The issue is of special legal significance on a question of bankruptcy and death of the person.
Depending on the particular context, the term is also used in reference to an estate in land or of a particular kind of property (such as real estate or personal estate). The term is also used to refer to the sum of a person's assets only." [Estate (law). Wikipedia]
The example "Composition of estates" was created using the ConceptDraw PRO diagramming and vector drawing software extended with the Divided Bar Diagrams solution from the Graphs and Charts area of ConceptDraw Solution Park.
Divided bar chart
Metro Maps

- Serious crime in Cincinnati | Column Chart Examples | Bar Graphs ...
- Bar Graphs | Serious crime in Cincinnati | Column Chart Examples ...
- Bar graph - Serious Crime in Cincinnati | How to Create a Column ...
- Chart Maker for Presentations | Serious crime in Cincinnati | Column ...
- Serious crime in Cincinnati | Column Chart Examples | How to ...
- Crime Bar Graph
- Bar Graph On Cyber Crime
- Bar Graph | Serious crime in Cincinnati | Bar Diagrams for Problem ...
- Bar Chart Examples
- Serious crime in Cincinnati | Warehouse security quiz | How to ...
- Sales Growth. Bar Graphs Example | Bar Graph | Bar Diagrams for ...
- Sales Growth. Bar Graphs Example | Bar Chart Examples | Bar ...
- Bar Graphs | Ice Hockey Rink Dimensions | Bar Graph | Blue Bar ...
- Outstanding trends of wastewater treatment plants | Line Graph ...
- Sales Growth. Bar Graphs Example | Column Chart Software ...
- Bar Graphs | Sales Growth. Bar Graphs Example | Bar Chart ...
- Growth Rate Using Bar Graph
- Column Chart Template | Column Chart Software | Chart Maker for ...
- Bar Graphs Png
- Bar Graphs | Sales Growth. Bar Graphs Example | Rainfall Bar Chart ...