Critical Path Method in ConceptDraw PROJECT
The Critical Path Method (CPM) is an algorithm for scheduling a set of project activities. It is an important tool for effective project management. ConceptDraw PROJECT implements this method to provide the user with a wide set of project management tools.
 Current Activities Reports
The Current Activities Reports solution extends abilities of project management software ConceptDraw PROJECT in high-quality planning and managing projects. It delivers the capability to generate the Completed Tasks, Critical Tasks, Tasks in Progress, Unstarted Tasks, and Overdue Tasks reports, which help to reflect clearly the actual situation in a project, the tasks statuses, the project cost at the moment, to compare the planned amount of work to the actually performed one. The set of professionally developed examples also included to this management solution, will help you to explore all power of this solution and to experiment with its variety of reports in a spreadsheet format, which perfectly suit for demonstrating at the regular meetings with members of project team and for the meetings with the company's executives, at this your report will look exceptionally both in electronic and printable view.
 MINDMAP Reports
The MINDMAP Reports solution extends the boundaries of interrelations between the ConceptDraw MINDMAP and ConceptDraw PROJECT applications. After planning your projects in a project management software, you can then implement them and display the reports in a graphical format of visual Mind Maps. Intended for all project managers, team leaders, management assistants, and other project participants, this solution offers the set of project examples and a wide choice of report kinds, which you can generate in a moment in a form of Mind Map document to track visually your project results and progress, to analyze the work of project team and individual employees, to control the tasks' execution, including the top level and critical tasks, the project milestones and many other key project parameters.
 Seven Management and Planning Tools
Seven Management and Planning Tools solution extends ConceptDraw PRO and ConceptDraw MINDMAP with features, templates, samples and libraries of vector stencils for drawing management mind maps and diagrams.
 Visual Reports
The Visual Reports solution extends abilities of ConceptDraw PROJECT by creating the illustrative, informative, colourful and comprehensible reports on a project in a form of visual graphs and diagrams of common types, such as Bar Charts, Pie Charts, Line Charts, Divided Bar Charts, Timelines, Dial Dashboards. This highly effective project management tool helps project managers and other stakeholders to report about the tasks statuses, the project progress and degree of its completion, to evaluate the project status, to depict the project expenses by days and to define the days that go beyond the budget, to compare visually the actual expenses and expected ones at the project planning stage, to generate the Resource chart depicting the utilization of project resources by days, and to show other useful information. The set of tailor-made examples developed for the Visual Reports solution allows designating advantages of each type of report included to this solution for the further use in your management work.
 Timeline Diagrams
Timeline Diagrams solution extends ConceptDraw PRO diagramming software with samples, templates and libraries of specially developed smart vector design elements of timeline bars, time intervals, milestones, events, today marker, legend, and many other elements with custom properties, helpful for professional drawing clear and intuitive Timeline Diagrams. Use it to design simple Timeline Diagrams and designate only the main project stages, or highly detailed Timeline Diagrams depicting all project tasks, subtasks, milestones, deadlines, responsible persons and other description information, ideal for applying in presentations, reports, education materials, and other documentation.
Gantt Chart Software
The Gantt Chart is the main interface in ConceptDraw PROJECT. It summarizes the tasks in your project and presents them graphically so you can easily view your progress.Gantt chart examples
All Gantt charts were made using ConceptDraw PROJECT. ConceptDraw PROJECT works both on Windows and Mac OS X. It allows to schedule a voluntary number of projects in a single Workspace document and lets easily share tasks and resources among them. ConceptDraw PROJECT shares files among Windows and Mac OS X.PERT Chart Software
PERT Chart Software - Activity Network and Project Evaluation and Review Technique, or PERT, charts are a way of documenting and analyzing the tasks in a project. ConceptDraw PRO is a powerful diagramming and vector drawing software for designing professional looking PERT Charts quick and easy.Problem solving
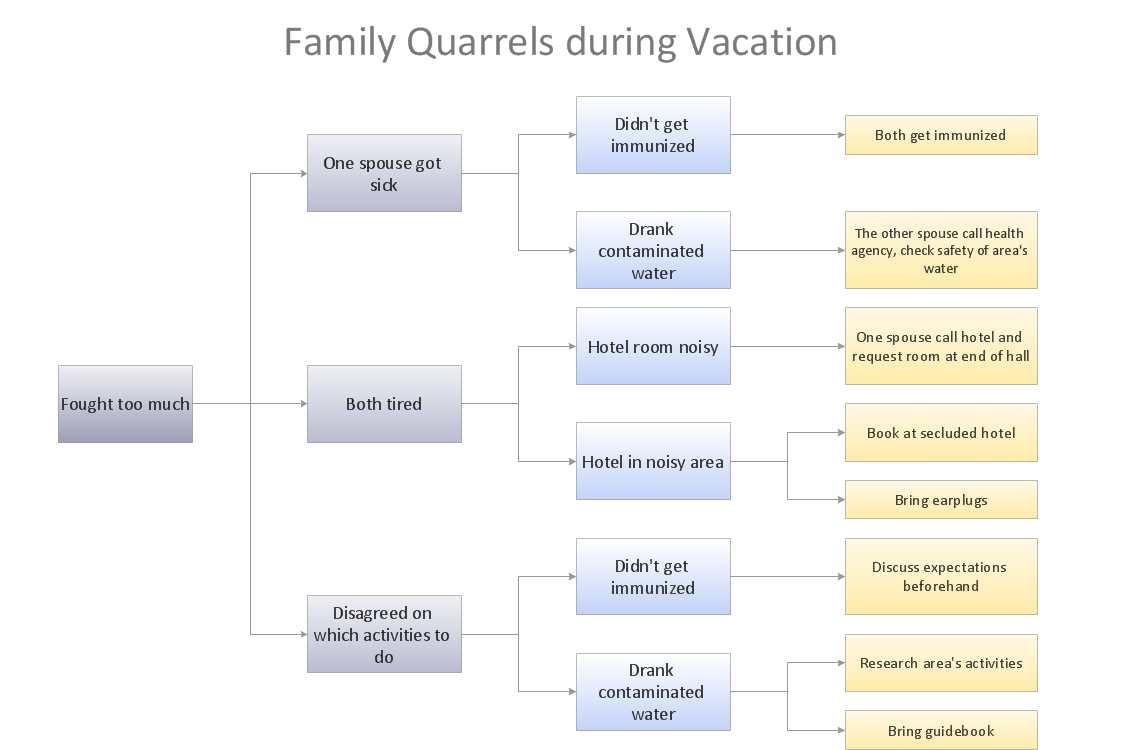
Problem Solving - ConceptDraw Office suite is a software for the problem solving. The Seven Management and Planning Tools solution is a set of such tools for investigating complex problems. These tools are exemplary at organizing research, parsing complex problems, providing a structure for the details, helping managers make decisions, and organizing effective communications in a visual manner that keeps everyone involved.
- Critical Path Network For Electrical Installation
- Gantt Chart In Electrical Installation
- Best Example Of Pert Cpm In Construction
- How to Use Critical Path Analysis for Scheduling Complex Projects ...
- What is Gantt Chart (historical reference) | Critical Path Method in ...
- C P M Videos Download
- Process Flow Chart For Electrical Installation
- Free Software To Draw Critical Path
- Landscape Architecture with ConceptDraw PRO | Biology Drawing ...
- Path Digram


