This site uses cookies. By continuing to browse the ConceptDraw site you are agreeing to our Use of Site Cookies.

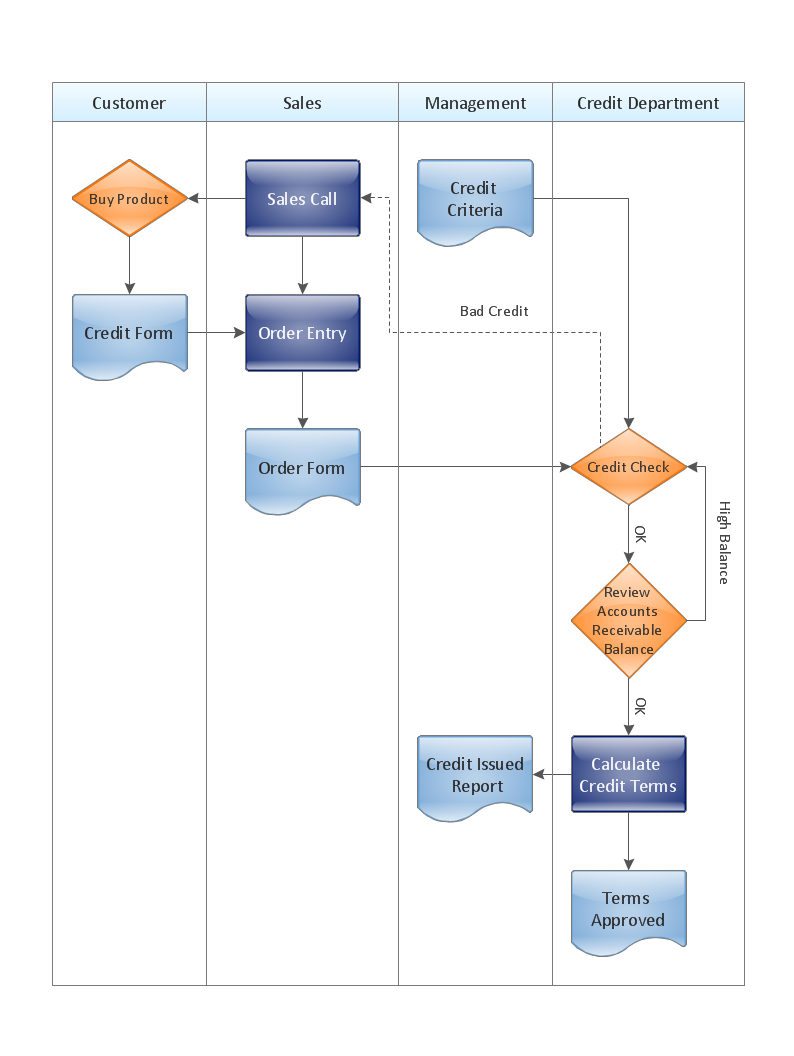
What is a Cross Functional Flow Chart?

For those who want to know what is a cross functional flowchart and how to draw it, we preared a special library and professional looking templates. Take all the advantage of your drawing software to learn and create such a well-designed flowcharts. Watch the HowTo video to learn more.

Activity Network (PERT) Chart

Activity Network and Project Evaluation and Review Technique, or PERT, charts are a way of documenting and analyzing the tasks in a project. This diagram is constructed as part of the process in creating a schedule of corrective actions. The Activity Network Chart (PERT) shows the logical connections and consequence of tasks to be performed. It displays the time period for problem solving and the implementation of all activities through the critical path.

Understanding the Audit Process: A Comprehensive Guide. Audit Process Flowchart

Audit Process Flowchart, Audit Flowchart - Audit Flowcharts solution for ConceptDraw DIAGRAM Solution Park provides the Audit Flowcharts library with wide variety of predesigned audit flowchart symbols, and also the set of templates and samples allowing you design your own audit flowchart or audit process flowchart in one moment. Simply use any of offered samples and change it for your needs, or fill the desired template.

decision maker, analytic hierarchy process (ahp), t chart, decision matrix, decision tree analysis Decision Making

decision maker, analytic hierarchy process (ahp), t chart, decision matrix, decision tree analysis
The Decision Making solution offers the set of professionally developed examples, powerful drawing tools and a wide range of libraries with specific ready-made vector decision icons, decision pictograms, decision flowchart elements, decision tree icons, decision signs arrows, and callouts, allowing the decision maker (even without drawing and design skills) to easily construct Decision diagrams, Business decision maps, Decision flowcharts, Decision trees, Decision matrix, T Chart, Influence diagrams, which are powerful in questions of decision making, holding decision tree analysis and Analytic Hierarchy Process (AHP), visual decomposition the decision problem into hierarchy of easily comprehensible sub-problems and solving them without any efforts.

sentence diagrammer, sentence diagrammer program, sentence diagram, free sentence diagrammer    Language Learning

sentence diagrammer, sentence diagrammer program, sentence diagram, free sentence diagrammer
Having the language learning experience and the decent tool for creating the language-related drawings are two keys to becoming a successful teacher. Good education becomes more and more important these days so making it possible to teach someone some language within a short period of time might make any teacher a successful and a popular one leading to more success and so the popularity. Using the ConceptDraw DIAGRAM charting and drawing software for making any needed scientific and educational illustrations seems to be the best choice to make.

Affinity Diagram

The Affinity Diagram, also known as a KJ diagram, is a business tool invented for organization the large quantity of ideas and data. It is a part of Seven Management and Planning Tools, it is usually used right after brainstorming to sort large numbers of ideas into the corresponding groups. The Affinity Diagram helps to represent in a better way the structure of large and complex factors which influence on a problem, divides these factors into the smaller and simpler structures, and helps team members to see the patterns and identify possible solutions to problems they have. The diagrams of this type don't show the causal relationships between the factors, but they are designed to prepare the data for holding further analysis of the cause-effect relationships. Another area of Affinity Diagram usage is contextual inquiry as a way to sort observations and notes from field interviews, support call logs, open-ended survey responses organizing, etc. ConceptDraw MINDMAP software offers you the tools for easy holding brainstorming, generation ideas and creation MINDMAP Affinity Diagram.

Management Tools — Total Quality Management

The Total Quality Management Diagram solution helps your organization visualize business and industrial processes. Create Total Quality Management diagrams for business process with ConceptDraw software.

medical symbol, medical illustration, doctor symbol, medical specialties, medical diagnosis, medical imaging Medical Illustrations

medical symbol, medical illustration, doctor symbol, medical specialties, medical diagnosis, medical imaging
Medical Illustrations solution including the set of professionally developed examples and samples dedicated to medicine, large variety of ready-to-use vector objects and icons of diagnostic equipment, treatment equipment, medical instruments, tools and devices, medical professionals and health workers of different medical specialties, medical procedures and patients, medical pictograms and medical symbols, among which are the famous red cross symbol, heartbeat symbol, doctor symbol, and many others, is a perfect help in questions of medical illustration and medical imaging, creation professional-looking, colorful and attractive Medical illustrations, Medical diagrams and infographics, slides for presentations in a field of medicine and health care, depicting the medical facts, the information about varied diseases and ways of medical diagnosis, methods of prevention and treatment diseases.

fire emergency floor plan, evacuation floor plan Fire and Emergency Plans

fire emergency floor plan, evacuation floor plan
The Fire and Emergency Plans solution was developed in order to provide all ConceptDraw DIAGRAM users with most common tools that might be needed for creating both Fire and Emergency Plans. Apart from the emergency managers, the Fire and Emergency Plans solution suits for electricians, interior designers, telecommunications managers, builders and other technicians.

Human Resources

Human resources is the set of individuals who make up the workforce of an organization, business sector, or economy. ConceptDraw DIAGRAM diagramming and vector drawing software extended with unique HR Flowcharts Solution from the Management Area of ConceptDraw Solution Park is the best for designing various flowcharts and diagrams in the field of human resources management.

Amazon Web Services, AWS, Amazon cloud AWS Architecture Diagrams

Amazon Web Services, AWS, Amazon cloud
AWS Architecture Diagrams with powerful drawing tools and numerous predesigned Amazon icons and AWS simple icons is the best for creation the AWS Architecture Diagrams, describing the use of Amazon Web Services or Amazon Cloud Services, their application for development and implementation the systems running on the AWS infrastructure. The multifarious samples give you the good understanding of AWS platform, its structure, services, resources and features, wide opportunities, advantages and benefits from their use; solution’s templates are essential and helpful when designing, description and implementing the AWS infrastructure-based systems. Use them in technical documentation, advertising and marketing materials, in specifications, presentation slides, whitepapers, datasheets, posters, etc.

network layout, network floor plan, network visualization, network topologies, network topology mapper Network Layout Floor Plans

network layout, network floor plan, network visualization, network topologies, network topology mapper
Network Layout Floor Plans solution extends ConceptDraw DIAGRAM software functionality with powerful tools for quick and efficient documentation the network equipment and displaying its location on the professionally designed Network Layout Floor Plans. Never before creation of Network Layout Floor Plans, Network Communication Plans, Network Topologies Plans and Network Topology Maps was not so easy, convenient and fast as with predesigned templates, samples, examples and comprehensive set of vector design elements included to the Network Layout Floor Plans solution. All listed types of plans will be a good support for the future correct cabling and installation of network equipment.

Cisco People. Cisco icons, shapes, stencils and symbols

The ConceptDraw vector stencils library Cisco People contains symbols for drawing the computer network diagrams. Vector stencils library "Cisco People" contains 17 pictogram symbols and clipart for drawing the computer network diagrams using the ConceptDraw DIAGRAM diagramming and vector drawing software.

human resources, human resource management, recruitment, hiring process, human resource development HR Flowcharts

human resources, human resource management, recruitment, hiring process, human resource development
The HR Flowcharts solution is ideal for using while creating the HR-related drawings in the ConceptDraw DIAGRAM charting and drawing software, providing with a comprehensive collection of human resources themed icons, connectors, and images from the available stencil libraries, helping illustrating flowcharts, infographics and workflow diagrams.

workflow diagram software, workflow patterns Workflow Diagrams

workflow diagram software, workflow patterns
Evaluate all advantages of workflow diagram software ConceptDraw DIAGRAM extended with the Workflow Diagrams solution that includes workflow examples and samples, workflow diagram template, a library of workflow diagram symbols and pictorial vector clipart for drawing visual and intuitively understandable Workflow diagrams. Design pictorial Work flow chart or Work flow diagram easier than ever, use them for documentation and implementation purposes, export in a variety of common graphics formats and share with colleagues. Extend the already wide area Work flow diagrams' applications that are used today in the manufacturing industry, software development, HR, medicine, banking and finance sphere, education, military, government, business, e-commerce, and many other fields.

energy, oil and gas, energy industry, oil industry, oil and gas industry infographics, oil and gas symbols, oil and gas graphics Oil and Gas

energy, oil and gas, energy industry, oil industry, oil and gas industry infographics, oil and gas symbols, oil and gas graphics
The Oil and Gas solution for ConceptDraw DIAGRAM software provides vector libraries of oil and gas symbols and a collection of samples for quick and simple designing of the oil and gas industry infographics, illustrations, presentations, diagrams. The resulting oil and gas graphics and illustrations help to clearly and quickly detail complex information. They are ideal for reporting on the development of best practices in oil and gas exploration and production. Use them to illustrate growth strategies and trends in the oil industry, conduct analysis, forecast the energy industry, and present the results of international energy forums.

Org Chart Diagram

ConceptDraw Office products and PM solutions included to ConceptDraw Solution Park support many project methodologies, among them Agile and Simple Projects, which help in implementing the best practices in project management. ConceptDraw Office applications give effective support in solving the issues related with planning, tracking, events, milestones, resource usage, and many other project management functions. ConceptDraw MINDMAP software provides the great advantages of a Mind Map hierarchical tree structure during the process of development the organizational structure of an organization. When you need to make the Organizational Chart, you can use any ConceptDraw DIAGRAM or ConceptDraw MINDMAP software. If you already have a designed Mind Map, it is incredibly easy to generate an Organizational Chart directly from ConceptDraw MINDMAP. You need simply double-click the corresponding icon, all the rest will be made automatically. The Organizational Chart will be created from the active page of your map, outputted to ConceptDraw DIAGRAM and opened in Slideshow mode.

sales funnel, funnel, business funnel, funnel chart, funnel diagram, funnel management, lead funnel, marketing and sales funnel, marketing sales funnel, sales funnel examples, sales funnel stages Funnel Diagrams

sales funnel, funnel, business funnel, funnel chart, funnel diagram, funnel management, lead funnel, marketing and sales funnel, marketing sales funnel, sales funnel examples, sales funnel stages
Funnel Diagrams solution including wide range of Funnel diagram samples, Sales funnel examples, and vector design elements, makes the ConceptDraw DIAGRAM ideal for managing funnel and creating the Funnel diagrams of various types and designs, AIDA Model, AIDAS, ACCA Dagmar, Rossiter-Percy Model, sales funnel, marketing funnel, search funnel, brand funnel, purchase funnel, lead funnel, conversion funnel, business funnel, etc. You can place the funnel object horizontally or vertically, you can use the objects with the desired number of sales funnel stages. You can also change their size, color fill and other parameters to make the Funnel diagrams look extremely suitable to your desires.

Network Visualization Guide.
How to Use ConceptDraw Network Visualization Tool

ConceptDraw DIAGRAM makes the entire process of network visualization easier thanks to the numerous ready-to-use objects included in the package for presentation of network equipment, LDAP directory symbols and many other objects that symbolize resources in most various representations.

EXPRESS data modeling language, data modeling tools, database diagram tool, database design tool, Database Model Diagram, EXPRESS-G data Modeling Diagram

EXPRESS data modeling language, data modeling tools, database diagram tool, database design tool, Database Model Diagram,
EXPRESS-G data Modeling Diagram solution extends the ConceptDraw DIAGRAM software functionality with capabilities of EXPRESS data modeling language, includes powerful data modeling tools, Express-G diagram tool, database diagram tool, database design tool, wide variety of pre-made vector objects of EXPRESS-G notation and EXPRESS-G diagrams samples allowing software developers, software designers, software engineers and other stakeholders to make their data models for information systems, to develop the databases, to learn the principles of construction EXPRESS-G diagrams and helping to draw their own EXPRESS-G Data Modeling Diagrams, Express-G Diagrams or Database Model Diagram without any efforts.